Climate Change · Part I
The importance of our climate in history of human civilisation
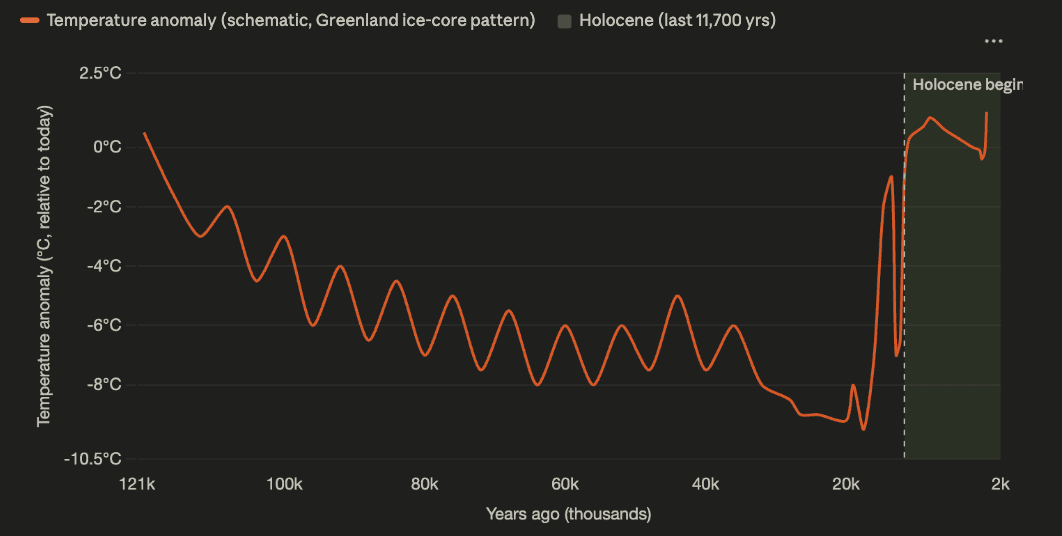
Figure 2. Global temperature swings before the Holocene, from a Greenland ice-core pattern. The green band marks the last 11,700 years of unusual stability — the window in which every farm, every city, and every civilisation we know was built.
Thinking about the future is hard. The future is uncertain — that’s why it is hard. Nonetheless, I still find thinking about the future important, because it might be terrifying or exciting. Rarely are people indifferent about the future. If it is terrifying, then you can mentally prepare for the bad cases; and if it is exciting, then you are likely more motivated to work toward the good outcomes.
Recently, in the WEF’s Youth Pulse Survey for Davos 2026, nearly 4,600 young people (18–30) across 144 countries mentioned their biggest concerns about the world in the future — and here is the result.[1]
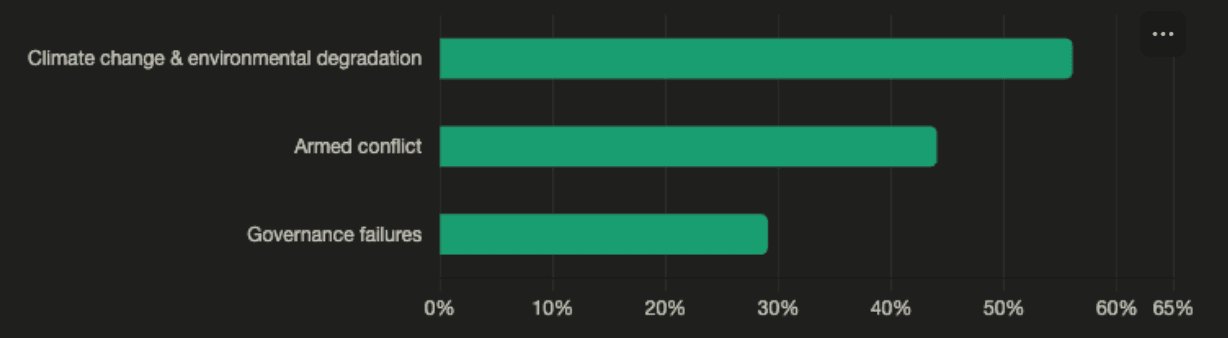
And they have the right reason to be concerned about our climate. We have taken our climate for granted for a long time. Since the last glacial period ended around 11,700 years ago,[2] the Earth has entered a long phase of climate stability that enabled our agricultural revolution and civilisational expansion — the very window shown at the top of this essay.
1.History of our climate and how it enables civilisation
In order to understand how our climate stability has enabled human civilisation, we first have to understand what climate means.
Climate is defined as the long-term, average pattern of weather in a place — typically measured over a period of about 30 years. It describes what you’d expect on a given day or season in a location: how hot or cold, how wet or dry, how windy, and how those things vary across the year.
The key distinction is that weather is what you get, climate is what you expect. Typical components of a place’s climate:
- Temperature — averages, seasonal swings, extremes.
- Precipitation — how much rain / snow falls, and when.
- Humidity, wind patterns, sunshine hours — the full picture.
And factors that shape the climate of a place:
- Latitude — nearer the equator gets more direct sun and stays warm; nearer the poles gets less.
- Elevation — higher places are cooler.
- Proximity to oceans — water heats and cools slowly, so coastal places have milder, less extreme climates than interior ones at the same latitude.
- Ocean currents and prevailing winds — for example, the Gulf Stream is the reason Western Europe is much milder than places at the same latitude in North America.
- Large-scale atmospheric circulation — the patterns that create deserts, monsoons, and rainforest belts at fairly predictable latitude bands around the globe.
Now that we have a general understanding of what climate is, let’s go back in time 11,700 years to understand how climate stability affected human evolution.
During the last glacial period, temperatures swung wildly — driven by the huge, unstable ice sheets covering North America and northern Europe, which periodically dumped meltwater into the North Atlantic and disrupted ocean circulation. Some of these swings shifted temperature by 8 to 16 °C in total, though the change unfolded over a few decades rather than year to year.[3] But since the beginning of the Holocene epoch, starting 11,700 years ago, those ice sheets have largely melted away, and Earth’s climate has settled into the most stable stretch in a very long time.
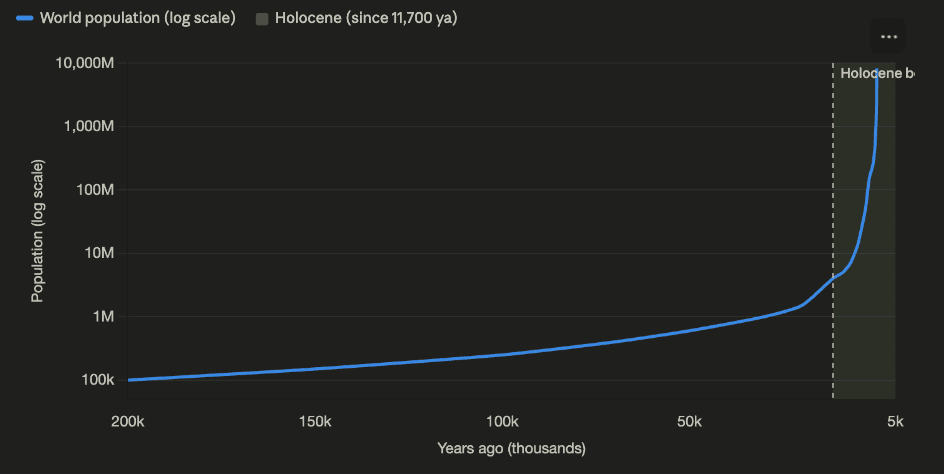
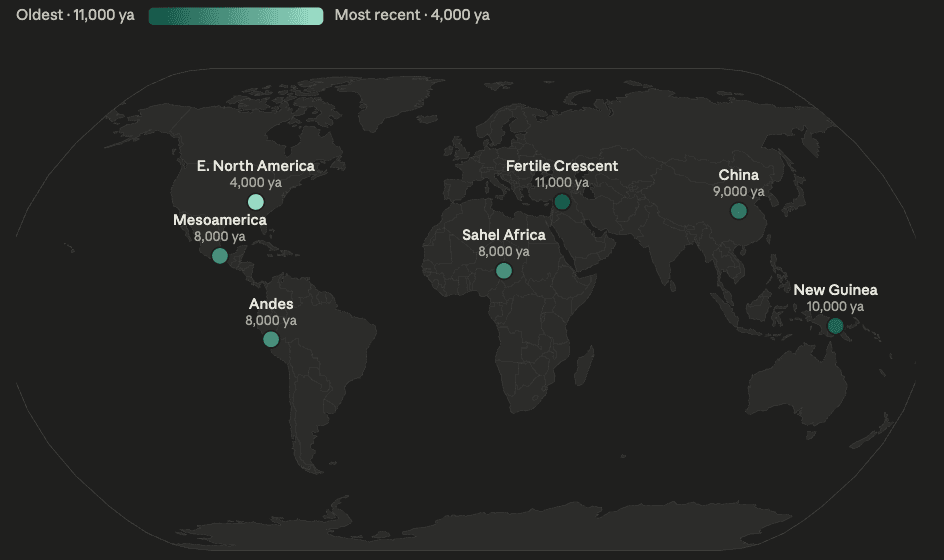
Interestingly, this stability lines up closely with the start of both a population explosion and an agricultural revolution that began independently in several places in the world[4] — the earliest, in the Fertile Crescent, within just a few centuries of the Holocene’s start, though it then took thousands more years to reach every region shown on the map below. Why was that the case, you may ask? Scientists have proposed a compelling hypothesis: that climate stability was a defining factor that enabled — and perhaps even made close to mandatory — human plant and livestock farming. Humans had been on Earth for 200,000+ years, yet for nearly all of that time we relied on foraging and hunting to feed ourselves. The climate before the Holocene was simply too turbulent for any long-term farming or settlement to survive it. Farming, unlike foraging, requires a long-term investment — collecting seed, planting, tending, and waiting for harvest, year after year, in one place. Climate stability, in that sense, was the defining precondition for human long-term settlement.
But now, things are changing.
Before we dive into how things are changing, I want to flag something important: climate is a genuinely complex system, with the atmosphere, oceans, ice sheets, and land surface all interacting over long timescales in ways that can produce unexpected effects. You can think of it a bit like a function with multiple variables, each one influencing the others.
It is worth being precise about what this complexity does and doesn’t affect. The core facts — that the climate is warming, that human activity is the cause, and that the current pace of change is unusual by the standards of at least the last 11,700 years — are established with very high confidence; that is not where the uncertainty lives. The real uncertainty is in the specifics: exact numbers at exact future dates, some regional-level impacts, and the precise strength or timing of certain feedback loops — partly because future emissions depend on choices humanity hasn’t made yet, and partly because a few feedback mechanisms are still active areas of research. So in what follows, I will do my best to lay out what is changing and what we can reasonably expect, while being clear about which parts are solid ground and which carry real ranges of uncertainty.
2.Mechanisms of our climate
In order to understand this complex system, we have to deep-dive one more time into the main five factors of climate and how they interact with each other. It will be quite technical — feel free to skip the nuts and bolts of how things work if you don’t want to get into too much detail. For those who want to learn, though, let’s go through each of them properly with specific examples to make it easier to understand and see how they interact with each other in the end.
Latitude — why the same sun heats places so differently
The core reason is geometry, not distance — Earth isn’t meaningfully closer to the sun at the equator than at the poles (in fact the distance difference of around 21 km is negligible in comparison to the distance from the Earth to the Sun of nearly 149.6 million km).[5] What differs is the angle at which sunlight strikes the surface.
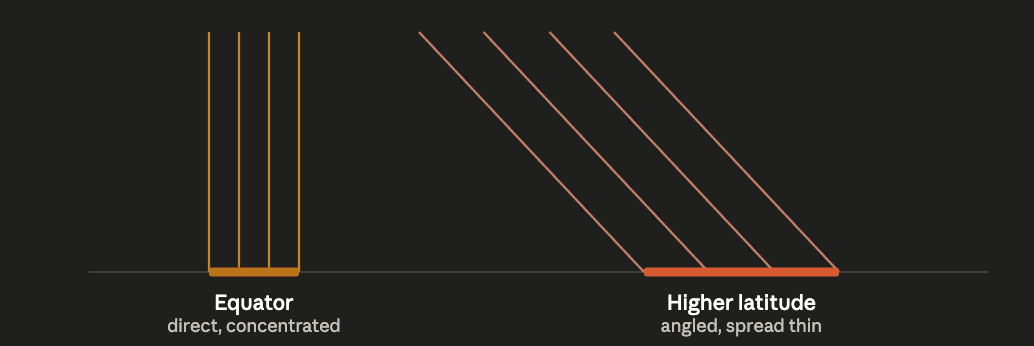
Both bundles of sunlight in that diagram carry the exact same amount of energy — but near the equator, where the sun sits nearly overhead, that energy lands on a narrow strip of ground, concentrated. At higher latitudes, the same sunlight hits at a shallow, glancing angle, so it spreads across a much wider strip — meaning any single patch of ground gets a diluted share of it. There is a second compounding effect too: that shallow-angle sunlight also has to travel through a much thicker slice of atmosphere to reach the ground, losing more energy to scattering along the way (the same reason sunsets look orange-red — you are seeing sunlight that travelled a long slanting path through the air).
There is also a day-length effect layered on top, caused by Earth’s 23.5° axial tilt: the equator gets close to 12 hours of daylight year-round, while polar regions swing between 24-hour daylight in summer and 24-hour darkness in winter.
For example, Singapore, almost exactly on the equator, sits at a nearly constant 27–31 °C every single day of the year — barely any seasonal variation at all. Murmansk, Russia, above the Arctic Circle, swings from weeks of continuous winter darkness with temperatures well below freezing to a brief summer with continuous daylight — an enormous seasonal range driven almost entirely by this latitude effect.
Elevation — why going up is like going toward the pole
As air rises, it moves into lower pressure (there is less atmosphere above pushing down on it), so it expands — and expanding gas cools, a real physical process called adiabatic cooling, the same reason a can of compressed air feels cold when you spray it. The standard rule of thumb is roughly 6.5 °C of cooling for every 1,000 metres you climb.[6] Combine that with thinner air simply holding less heat, and mountains function almost like a shortcut to polar conditions without changing latitude at all.
For example, Quito, Ecuador sits almost exactly on the equator (0°) — by latitude alone it should be sweltering tropical heat. But Quito sits at 2,850 metres elevation, so it actually has a mild, almost spring-like climate year-round, around 14–20 °C. Mount Kilimanjaro, despite standing barely 3° south of the equator in Tanzania, has permanently ice-capped terrain near its 5,895-metre summit (rapidly retreating due to warming, but still there) — proof that elevation alone can override even a strongly tropical latitude. This is also why hiking up a single tall mountain can take you through several distinct climate zones in one day — tropical at the base, temperate partway up, alpine tundra near the top.
Proximity to oceans — water as a giant thermal buffer
Water has a much higher heat capacity than land — it takes far more energy to warm a given mass of water by 1 °C than to warm the same mass of rock or soil, and water releases that stored heat back out just as slowly. So oceans act like enormous thermal batteries: they soak up summer heat without their surface temperature rising much, then release that stored warmth slowly through winter. Land, by contrast, heats up and cools down quickly with very little buffering.
This creates the well-known split between maritime climates (coastal, moderated, mild summers and mild winters) and continental climates (interior, extreme, hot summers and cold winters, big day-to-night swings too).
For example, San Francisco and Sacramento are barely 140 km apart in the same US state, at essentially the same latitude — yet San Francisco’s summer highs rarely creep above 24 °C thanks to the cold Pacific right next to it, while Sacramento regularly bakes past 35–38 °C in summer, because it’s just far enough inland to lose that oceanic buffering. Same sun, same latitude, wildly different climate, purely from ocean proximity.
Ocean currents and prevailing winds — heat delivered by conveyor belt
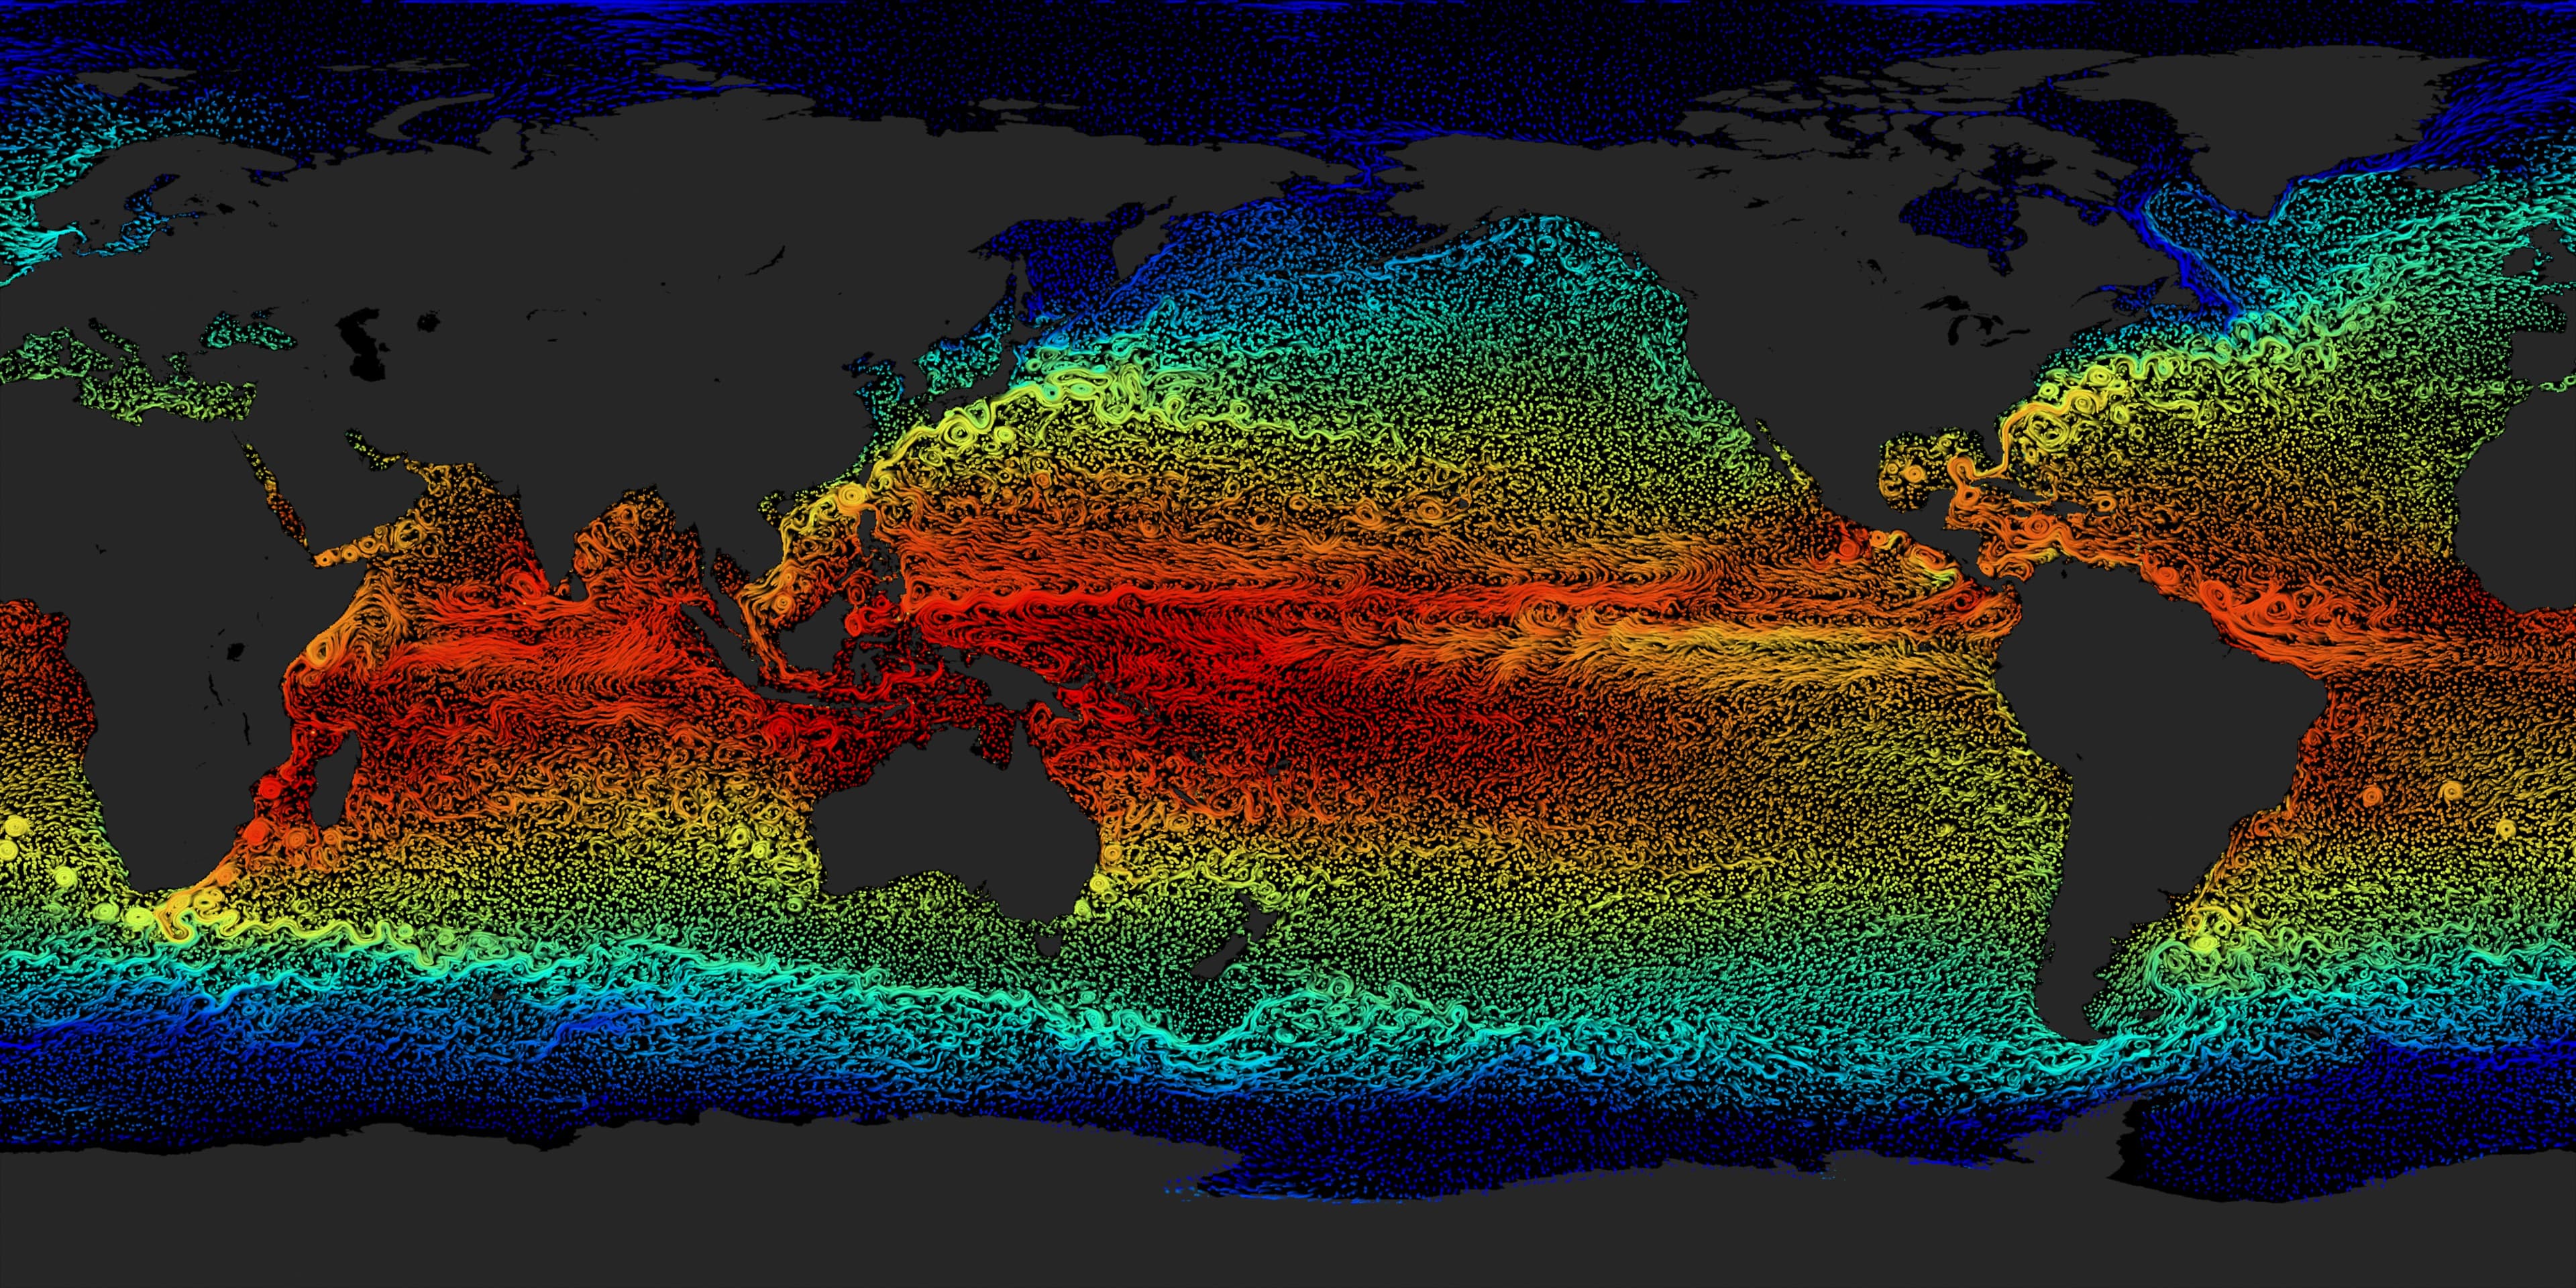
Oceans aren’t static — currents driven by wind, Earth’s rotation, and differences in temperature and salinity physically transport enormous volumes of warm or cold water around the globe, and prevailing winds then carry that heat (or cold) onto nearby land.
For example, the Gulf Stream is the textbook case and the numbers are dramatic. Warm water from the Gulf of Mexico flows northeast across the Atlantic, releasing heat into the air along the way; the prevailing westerly winds then carry that warmed air onto Western Europe.[7]
London sits at 51°N — further north than most of Canada — yet its January average hovers around 5–8 °C. Compare that to a spot at a genuinely similar latitude on the eastern side of North America (which doesn’t get the same benefit, and in fact often has the cold Labrador Current working against it): January averages there can run −15 to −20 °C. Same latitude band, roughly 20–25 °C of difference in winter temperature, driven substantially by which way the ocean happens to be moving.
A second, equally vivid example works the opposite direction: the cold Humboldt (Peru) Current flows up the west coast of South America from Antarctic waters, chilling the air above it. Combined with the descending dry air we’re about to discuss, this is a major reason the Atacama Desert in Peru and northern Chile — sitting at tropical-ish latitude — is one of the driest places on the entire planet, some parts having effectively never recorded measurable rainfall.
Large-scale atmospheric circulation — why deserts and rainforests line up in bands
This is where the equator’s intense heating (from the first factor) actually reaches out and shapes climate thousands of kilometres away, through a repeating pattern of rising and sinking air.

Warm, moisture-laden air at the equator rises, and as it climbs it cools, and cooling air can’t hold as much water vapour, so the moisture condenses out as heavy, near-daily rainfall. That is the mechanistic reason equatorial regions — the Amazon, the Congo Basin, Indonesia — are rainforests: it is not a coincidence of geography, it is this rising-air engine sitting directly overhead. Having dumped its moisture, that same air (now dry) spreads outward at high altitude and, by the time it reaches roughly 30° latitude north and south, sinks back down as bone-dry air. Sinking air discourages cloud formation and rainfall, which is exactly why the world’s great desert belts — the Sahara, the Arabian Desert, the deserts of the American Southwest and northern Mexico, the Australian Outback, the Kalahari — all cluster suspiciously close to the same ~30° band on nearly every continent. Same physical mechanism, repeating around the entire globe.
Monsoons are a related but distinct seasonal version of this same land-vs-ocean heating idea from before. Land heats up (and cools down) much faster than ocean. In summer, the Asian landmass heats rapidly, creating a zone of rising air and low pressure that pulls in moisture-laden ocean air — this is the monsoon, and it is why India receives something like 70–80% of its entire rainfall in just a few summer months.[8] In winter the pattern reverses: the land cools faster than the ocean, and dry air flows back out from the continent instead.
How these five factors actually interact
They compete, and sometimes one overrides another entirely. For example, Quito’s latitude says “should be sweltering,” but its elevation says “should be cool,” and elevation wins. London’s latitude says “should be nearly as cold as Canada,” but the Gulf Stream and prevailing winds say “keep it mild,” and the ocean current wins. The Atacama Desert’s latitude alone wouldn’t predict extreme aridity, but a cold ocean current plus descending 30°-latitude air stack together and produce one of the driest places on Earth. Real-world climate at any single point on the map is the net result of all five factors pulling at once.
3.The importance of Earth’s atmosphere
Now that we have a solid grasp of how climate on our planet works, it is important to zoom out a bit and understand how the atmosphere on Earth was formed, how it works (in relation to our climate), and how important it is to life on Earth.
How did Earth’s atmosphere form?
Earth’s air today isn’t its original air — it went through four distinct versions. A primary atmosphere of hydrogen and helium, captured straight from the cloud of gas Earth formed out of ~4.6 billion years ago, was stripped away almost immediately by the young Sun’s much fiercer solar wind. Earth’s interior then slowly refilled the sky through volcanic outgassing — CO₂, nitrogen, water vapour, and sulfur compounds bubbling up from the molten planet, giving Earth a second atmosphere that looked a lot like Venus’s or Mars’s does today: no oxygen, mostly CO₂. As Earth cooled, that water vapour condensed into rain and filled the oceans. And the oxygen-rich air we actually breathe didn’t exist until life itself created it — photosynthetic bacteria pumping out oxygen as waste, building up over roughly a billion years into the Great Oxidation Event (~2.4 billion years ago)[9] that transformed the entire atmosphere into something new.
How does our atmosphere work?
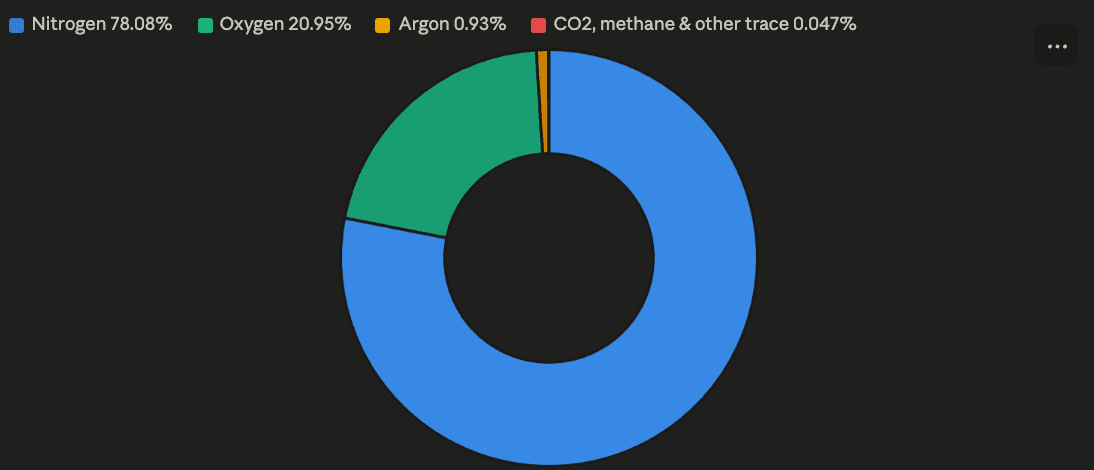
Nowadays, Earth’s atmosphere is roughly 78% nitrogen, 21% oxygen, just under 1% argon, and a small but critical 0.04%-and-rising slice of CO₂ and other trace gases,[10] plus variable water vapour. It is held in place by gravity — every gas molecule is essentially in free fall towards Earth, just moving sideways fast enough (and colliding with other molecules often enough) that it never actually lands. And it has several benefits for us.
- Insulation — keeps the surface roughly 33 °C warmer than it would be with no atmosphere at all.[11]
- Pressure — allows liquid water to exist on the surface. Without enough atmospheric pressure pressing down, water either boils away or sublimates straight to gas, even at cold temperatures.
- Circulation — allows the wind belts and ocean currents underneath to work, physically redistributing heat from equator to poles.
- Shielding — the ozone layer (in the stratosphere) absorbs most incoming UV radiation before it reaches the surface.
- Burning up debris — most meteors vaporise from friction before they ever reach the ground.
It is structured in layers, each behaving differently:[12]
- Troposphere (0–12 km) — where basically all weather happens, cooling as you go up.
- Stratosphere (12–50 km) — containing the ozone layer, actually warming with altitude because ozone directly absorbs UV there.
- Mesosphere (50–80 km) — the coldest layer.
- Thermosphere (80–600 km) — extremely hot per molecule but so thin it wouldn’t feel hot at all, where auroras occur.
- Exosphere (600–10,000 km) — Earth’s outermost layer, so thin it blends gradually into the vacuum of space with no firm upper edge, and where satellites like the ISS’s higher orbits and free-floating hydrogen and helium atoms drift before eventually escaping entirely.
How important is Earth’s atmosphere for life?
Without the atmosphere, temperature on Earth would be much more fluctuating. And in our solar system, Earth is the only one of the four terrestrial planets whose atmosphere lands in the specific pressure-and-temperature combination that allows liquid water. Mercury and Mars fail because their atmospheres are too thin; Venus fails for the opposite reason — its atmosphere is thick enough, but its composition traps so much heat that the surface is far too hot for water to stay liquid, no matter how sufficient the pressure is.
In the chart below, we can see how each planet’s temperature would be different without its atmosphere. Each planet’s actual measured temperature (dark bar) is set against what it would be with zero atmosphere at all (light bar).
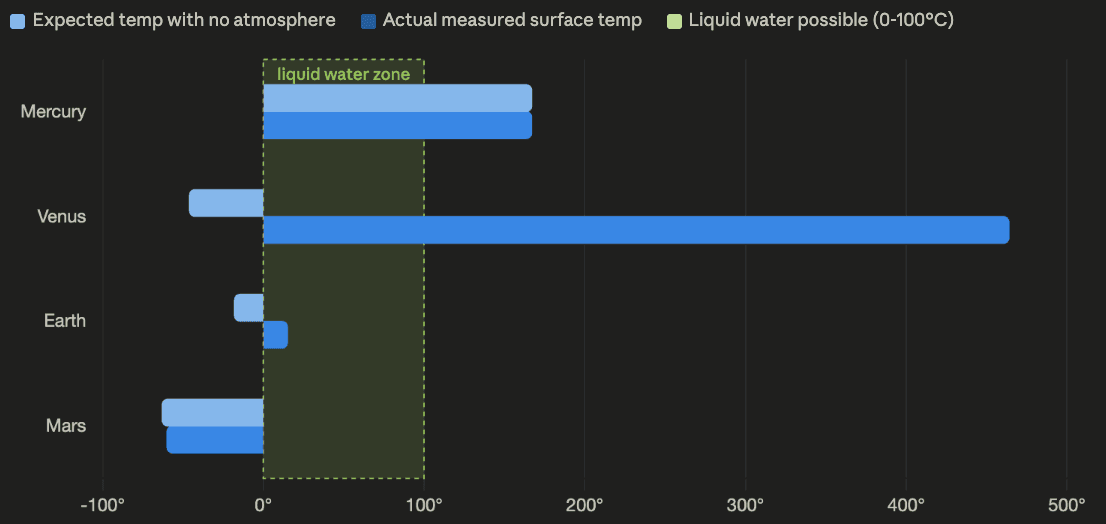
- Mercury has almost no gap between expected and actual temperature because it barely has an atmosphere to create one. With nothing to buffer it, Mercury swings between 430 °C by day and −180 °C by night, missing the liquid-water zone in both directions.
- Mars has only a ~3 °C gap — its atmosphere technically exists but is too thin (under 1% of Earth’s pressure) to do much of anything. Its actual −60 °C sits well below the zone: permanently frozen.
- Earth has a 33 °C gap, and it’s the only one that lands the planet inside the green band. That gap is doing exactly one job: pulling Earth up from a frozen −18 °C rock to a livable 15 °C world.
- Venus overshoots the zone by such a wide margin — a 510 °C gap — that it ends up hotter than Mercury despite reflecting away roughly 90% of its sunlight (versus Mercury absorbing nearly all of its own). Its atmosphere, nearly 100 times thicker than Earth’s and almost entirely CO₂, triggered a runaway greenhouse effect: rising heat evaporated any surface water into vapour (itself a greenhouse gas), trapping more heat, evaporating more, in a feedback loop that didn’t stop until the surface hit 464 °C — hot enough to melt lead.[13]
4.Changing greenhouse gases, climate warming, and instability
What are greenhouse gases?
Imagine Earth wrapped in an invisible blanket made of gas. Sunlight can pass right through this blanket easily and warm up the ground. But when the ground tries to send that heat back out into space at night, the blanket catches some of it and holds it close, instead of letting it all escape.
Greenhouse gases do exactly that. It is called “greenhouse” because a real greenhouse (a glass house for growing plants) works the same way — sunlight gets in easily through the glass, but the warm air has a harder time getting back out, so it stays cozy and warm inside.
A few things worth knowing about this blanket.
Earth needs some of this blanket to survive. Without any greenhouse gases at all, Earth would be a frozen ball at about −18 °C — too cold for the human body. So a little blanket is good and natural.
Not all gases make equally good blankets. The main ones are carbon dioxide (CO₂), methane (CH₄), and water vapour. Some, like methane, trap heat much more powerfully than others (e.g. 28–80 times more heat per molecule than CO₂),[14] even in tiny amounts — though they don’t usually stick around in the sky as long as CO₂ does.
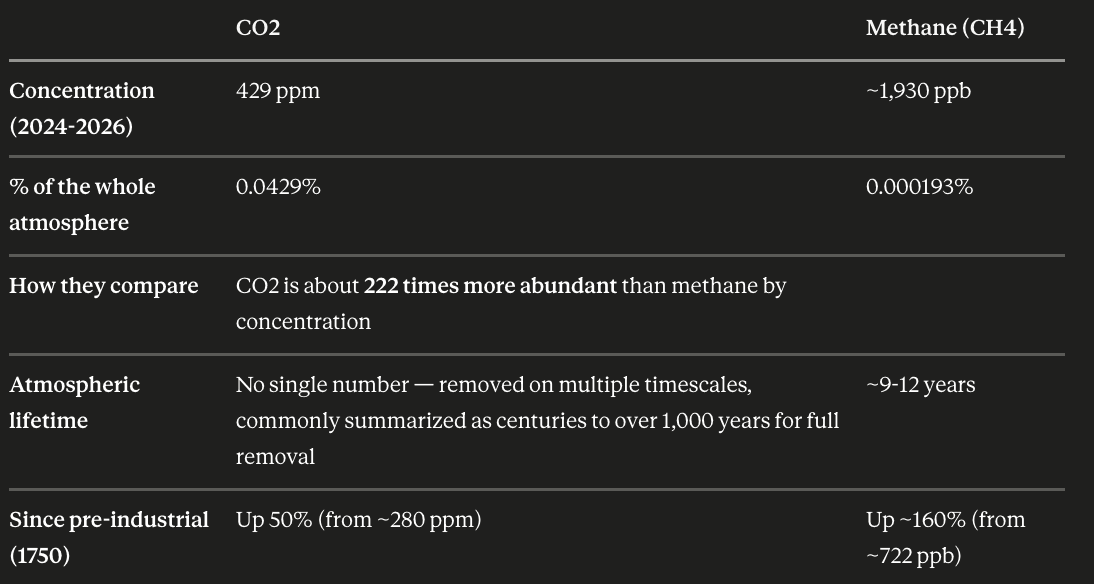
Most of the extra CO₂ humans have added comes from burning things — coal, oil, and gas (fossil fuels) to run cars, factories, and power plants.
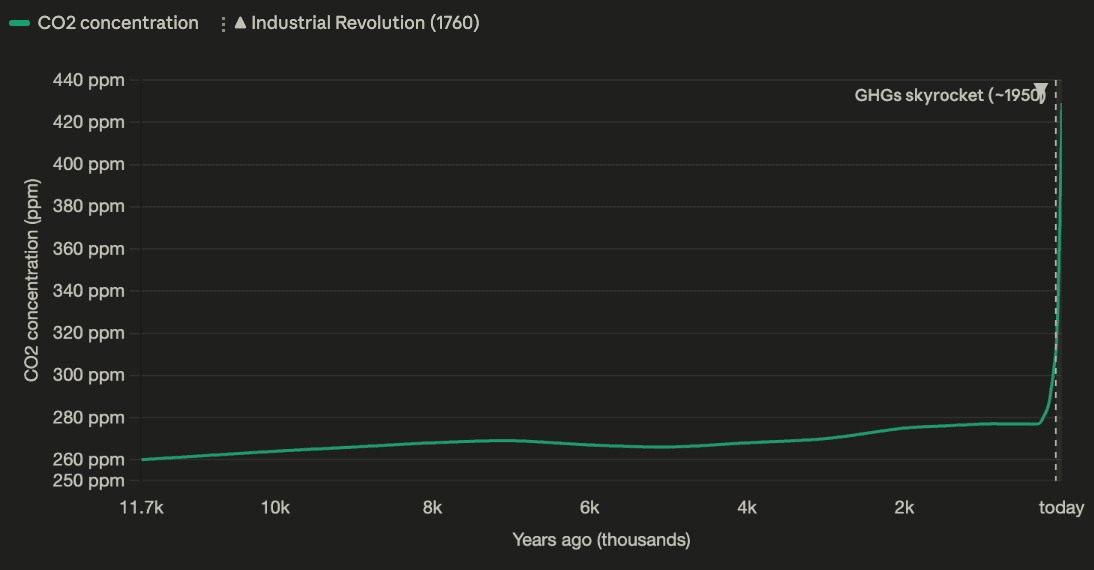
For basically the entire history of human farming and building cities — 11,700 years — the amount of blanket stayed almost exactly the same, hovering around 260–285 parts per million.[15] Then, around 1760, people started burning coal to run early machines and factories — the first Industrial Revolution.[16] That added a little extra blanket, but slowly.
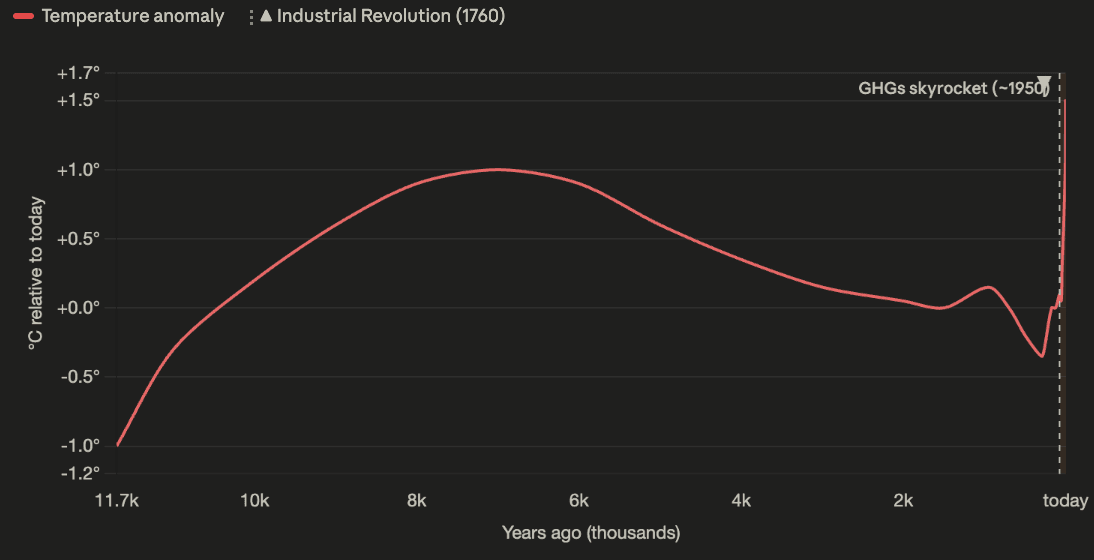
More blanket means more heat gets caught on its way out, instead of escaping to space. That trapped heat has to go somewhere — and it builds up, bit by bit, year by year, warming things up.
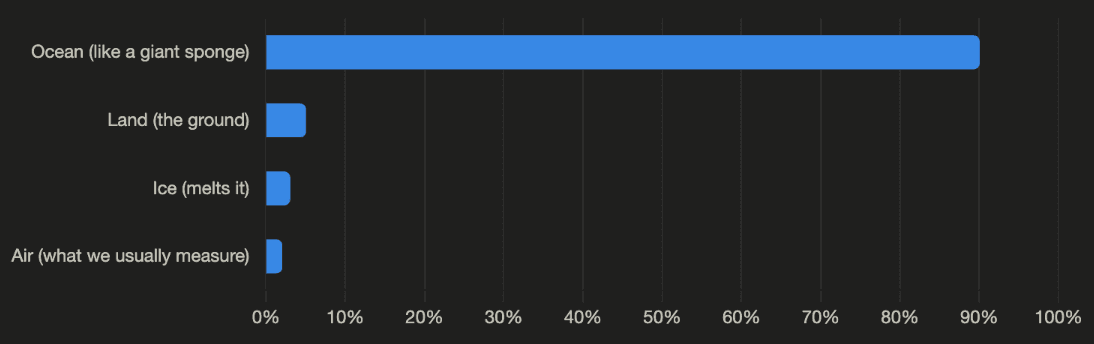
The interesting thing, though: nine out of every ten bits of extra heat sink quietly into the ocean, not the air.[17] The ocean is enormous and slow to change, so it soaks up almost all of the extra warmth like a giant sponge — which is actually part of why the air-temperature rise feels somewhat “delayed” and gradual rather than shocking all at once. But it also means the ocean is storing up a huge amount of extra energy for the long run, which is what drives things like coral bleaching, a messed-up water cycle, and stronger natural disasters.
A little bit of that heat warms the actual ground — which is why the frozen ground in cold places (called permafrost, like in Siberia) is thawing out, something it hasn’t done in thousands of years. A small bit goes into melting ice. And only a tiny sliver warms the air we breathe and measure with thermometers.
Global-warming feedback loops
It is also important to quickly mention that greenhouse gases account for only 0.04% of our atmosphere but, due to feedback loops, their warming power is stronger than that.
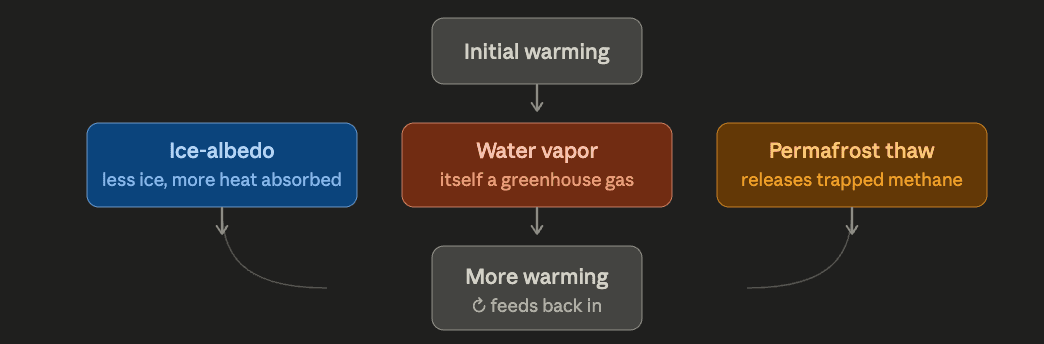
Each of these three loops takes a small initial push and turns it into a bigger one.
- Ice–albedo feedback: ice and snow are highly reflective — they bounce most incoming sunlight straight back to space. As warming melts that ice, it exposes darker ocean water or bare land underneath, which absorb sunlight instead of reflecting it. More absorbed heat means more melting, which exposes more darker surface, which absorbs more heat. This is the single biggest reason the Arctic is warming roughly 3–4 times faster than the global average[18] — the effect compounds specifically where ice used to be.
- Water-vapour feedback: warmer air can physically hold more water vapour (a straightforward property of air), and water vapour is itself a potent greenhouse gas — arguably the single largest contributor to the natural greenhouse effect that keeps Earth livable in the first place. So CO₂-driven warming causes more evaporation, which adds more water vapour, which traps more heat, which causes more evaporation. This feedback alone is estimated to roughly double the warming effect of CO₂ on its own[19] and seriously mess up our water lifecycle.
- Permafrost feedback: vast areas of frozen Arctic ground have locked away organic carbon (dead plant matter) for tens of thousands of years, essentially in a natural freezer. As that ground thaws, microbes start decomposing that ancient organic matter, releasing both CO₂ and methane (CH₄) — adding entirely new greenhouse gases that weren’t part of the original human-emissions calculation at all.[20]
Climate instability
How the rising of greenhouse gases (GHG) and feedback loops affect the five factors of our climate.
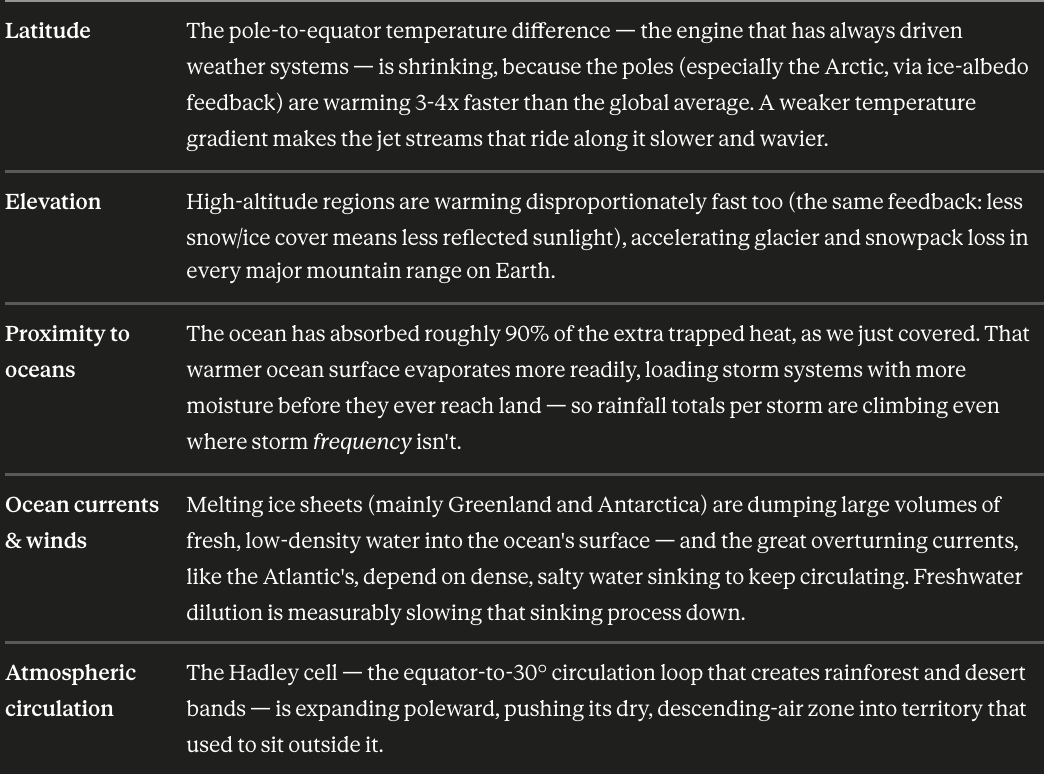
To make this complex system easier to understand, let’s look at a specific example: Western Europe.
- Latitude effect: the shrinking Arctic-to-equator temperature gradient is linked to a weaker, wavier jet stream[21] — and the jet stream is the thing that normally sweeps weather systems briskly across the UK, France, and Germany. A weaker jet stream gets “stuck” more often, creating blocking patterns that trap the same weather in place for weeks — which is the mechanism behind both the increasingly severe summer heatwaves (2003, 2019, 2022, 2026 all set records)[22] and the occasionally prolonged winter cold snaps Western Europe has seen recently.
- Elevation effect: the Alps — Western Europe’s defining mountain range — have lost a substantial share of their glacier volume in the last few decades,[23] and that ice isn’t just scenery: it feeds the summer flow of the Rhine, Rhône, and Po rivers, which millions of people and a huge share of European agriculture and hydropower depend on. Less glacier means less buffer during hot, dry summers exactly when river flow is needed most.
- Ocean-proximity effect: the North Atlantic and Mediterranean have both experienced significant marine heatwaves in recent years, and that added moisture is a real contributor to the kind of catastrophic flooding Western Europe has seen — the 2021 floods across Germany and Belgium are a frequently-cited case where a storm system, loaded with an unusually large amount of moisture, dropped rainfall far beyond historical norms in a matter of hours.[24]
- Atmospheric-circulation effect: the poleward-expanding Hadley cell dry zone is pushing directly into Southern and parts of Western Europe — the Mediterranean climate zone (Spain, southern France, Italy) is measurably drying and heating, with some regions now discussed in terms of genuine desertification risk,[25] a direct consequence of that dry band creeping further north than its historical position.
- Ocean currents and winds: the Gulf Stream that is moderating Western Europe’s mild climate is downstream of the Atlantic Meridional Overturning Circulation (AMOC) staying strong. And AMOC’s engine specifically depends on cold, salty water in the North Atlantic being dense enough to sink — which is exactly what large volumes of fresh Greenland meltwater interfere with, since fresh water is lighter and resists sinking.

Some recent studies have suggested a meaningfully elevated risk of significant AMOC weakening or even a form of collapse within this century,[26] while other researchers judge a full shutdown considerably less likely on that timescale. However, the direction of weakening has been measurable in recent decades, and further weakening is a well-grounded physical expectation as Greenland keeps melting. The worst-case outcome would be parts of the UK, Ireland, and Scandinavia potentially cooling by several degrees — running in the opposite direction from the global average warming everywhere else.
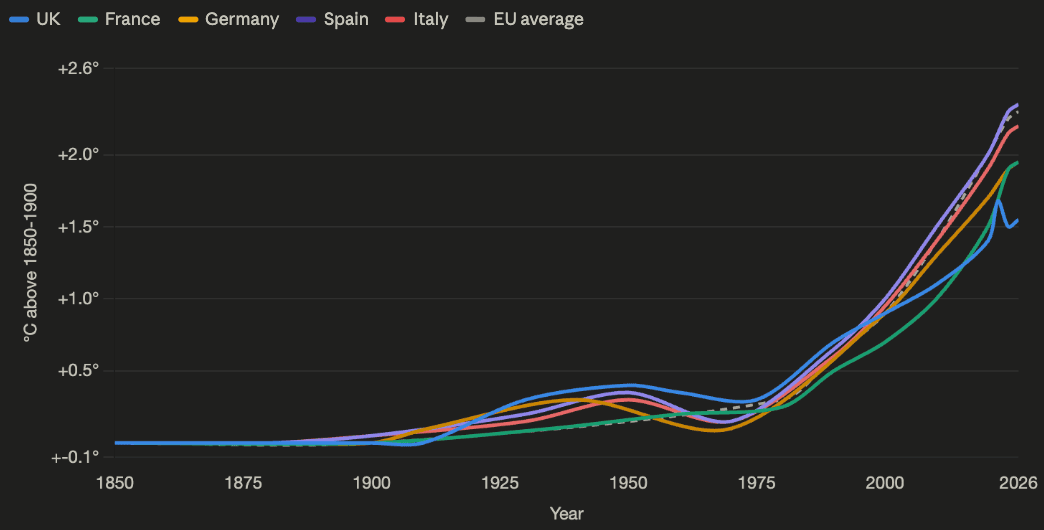
Here is the capture of temperature in different parts of Europe changing over the past centuries.[27]
- UK: still the slowest of the four, +1.68 °C at its 2022 record — the AMOC/Gulf Stream buffering effect showing up clearly.
- France and Germany track each other closely, both landing around +1.9 °C — two large continental-plus-coastal economies warming at nearly identical rates, both faster than the UK but not as fast as the EU average.
- Spain: +2.3 °C by 2024 — despite being coastal, it warms faster than any of the northern three, because the Mediterranean it borders is small and semi-enclosed rather than open ocean, so it can’t buffer heat the way the Atlantic does.
- Italy: +2.15 °C by 2024 — same Mediterranean-hotspot pattern as Spain, compounded by sitting directly in the path of the Hadley cell’s expanding dry zone pushing up from the south.
- EU-wide average: +2.2 to 2.4 °C — the highest of all six lines, pulled up by faster-warming members like Spain, Italy, Eastern Europe, and Scandinavia, none of which benefit from the Atlantic’s moderating effect the way the UK does.
5.How climate instability will affect human civilisation
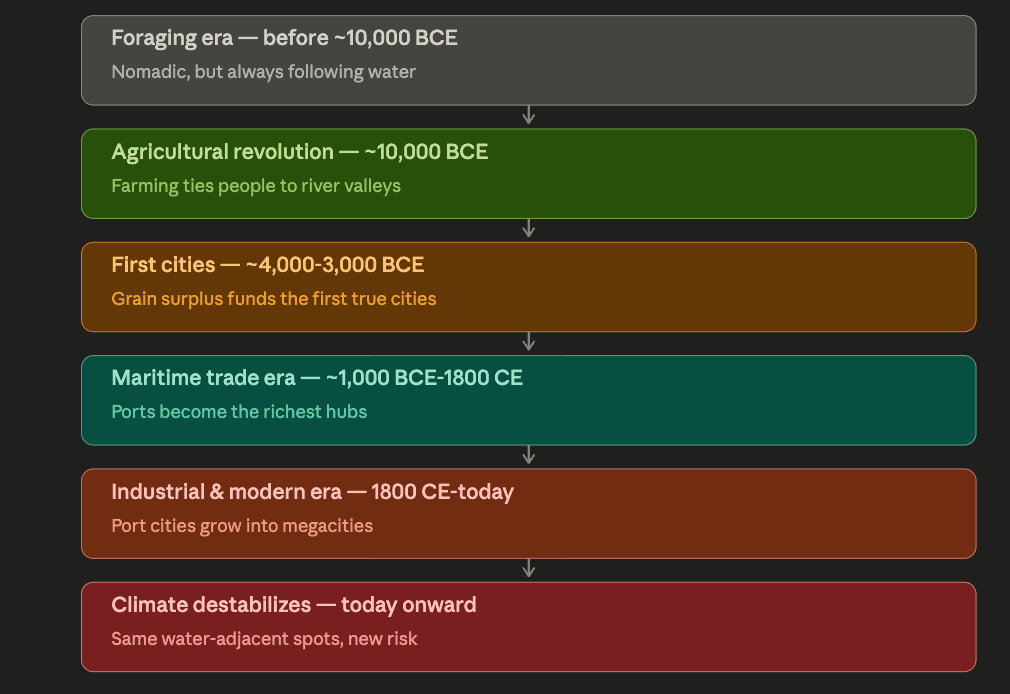
Climate stability was the key that unlocked early human settlement expansion into modern civilisation. For almost the entire time humans have existed — hundreds of thousands of years — the weather could swing wildly, sometimes flipping by huge amounts within a single person’s lifetime. In that kind of world, you can’t plant a seed and then wait five months for it to grow, because a sudden freeze could kill it before you ever get to eat. So people stayed foragers and hunters: find food that is already there, eat it, move on when it runs out. Simple, safe, and it worked — but it kept humanity’s population small and its way of life essentially unchanged for a very, very long time.
Then, 11,700 years ago, the wild swings just… stopped. The climate settled into the calm, predictable pattern we’ve been calling the Holocene. And that single change unlocked everything that came after, like a row of dominoes:
- Foraging & hunting: Even before anyone settled down, for hundreds of thousands of years hunter-gatherers organised their movement around water. Humans need water to drink daily, animals congregate at watering holes (so that’s where hunting is), and rivers and coasts offer fish and shellfish that don’t run away. So the human habit of clustering near water is older than agriculture, older than cities — it is baked into the species.
- Agricultural Revolution: Around 10,000 BCE humans began farming. Farming demands three things that river valleys supply better than anywhere else: reliable water for crops, and fertile soil. Rivers flood seasonally and deposit a fresh layer of nutrient-rich silt every year, naturally re-fertilising the fields for free. That’s why the very first farming took hold in places like the Fertile Crescent between the Tigris and Euphrates, the Nile valley, the Indus, and the Yellow River. Once humans started farming, they couldn’t wander anymore, so for the first time they became permanently settled where the farming was: on floodplains.
- The first cities: And then villages turned into cities. A really good river-valley farm produces more food than the farmers themselves eat — a surplus. That surplus is what lets some people stop farming and become something else: priests, soldiers, craftsmen, scribes, rulers, traders, etc. A city is essentially a dense concentration of people who don’t grow their own food, fed by the surplus of the farmland around them. The world’s first cities — Uruk in Mesopotamia, Memphis on the Nile, Mohenjo-daro on the Indus, around 4,000–3,000 BCE[28] — all sat in river valleys. The river also doubled as the highway for moving that grain to the city and trading it.
- Maritime trade: For most of human history, moving goods by water was 10 to 30 times cheaper than moving them overland — one boat could carry what hundreds of pack animals couldn’t.[29] So as civilisations started trading with each other rather than just feeding themselves, the most valuable real estate became the points where sea routes met land: natural harbours and river mouths. This is the era that produced Alexandria, Venice, Constantinople / Istanbul, Canton (Guangzhou), and later London, Amsterdam, and the great colonial ports. A river-mouth port was the jackpot — it connected sea shipping (goods from far away) to river shipping (goods from deep inland) at a single point. Trade concentrated wealth, wealth concentrated people, and coastal / delta cities began overtaking purely inland ones in size and importance.
- Industrialisation, modern civilisation, and mega-cities: Two things happened in the last 200 years. First, the Industrial Revolution needed exactly what ports offered: coal and raw materials shipped in, finished goods shipped out, all cheapest by water — so factories clustered in port cities and pulled in enormous populations of workers. Second, and more subtly: once a city got big, it stayed big through what economists call path dependence.[30] A city that already has the banks, ports, universities, roads, and skilled workers is the obvious place to build the next thing — so growth attracts more growth, largely regardless of whether the original geographic reason still applies. For example, New York isn’t huge today because ships need its harbour; it is huge because it is already New York, the financial and cultural centre of the US, and thanks to the flywheel of connections (similar to the social-network effect in digital tech) — everything simply wants to be where everything already is.
In short, climate is the thing that decides where water reliably shows up — which rivers flow, which coasts get calm enough seas for a safe harbour, which regions get enough rain. So climate stability didn’t just make farming possible — it also kept the map of “where water is” basically frozen in place for 11,700 years, which let a city built by a river 5,000 years ago still be in the right spot today.
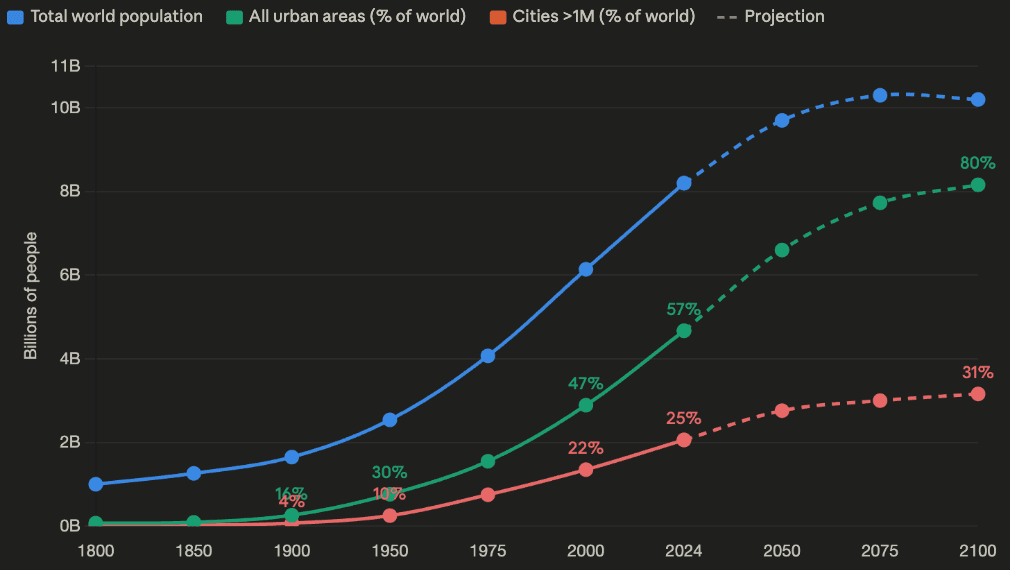
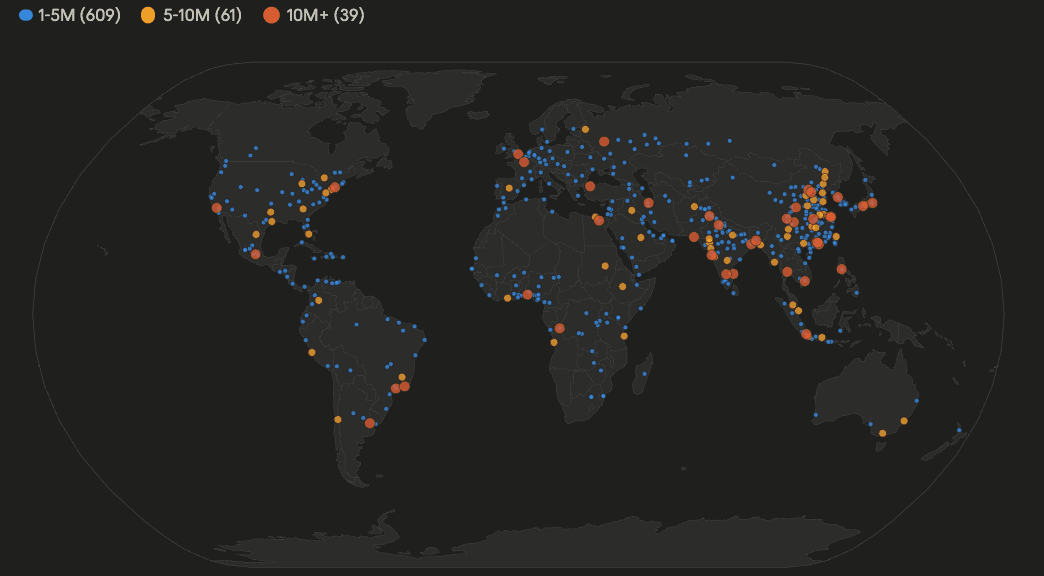
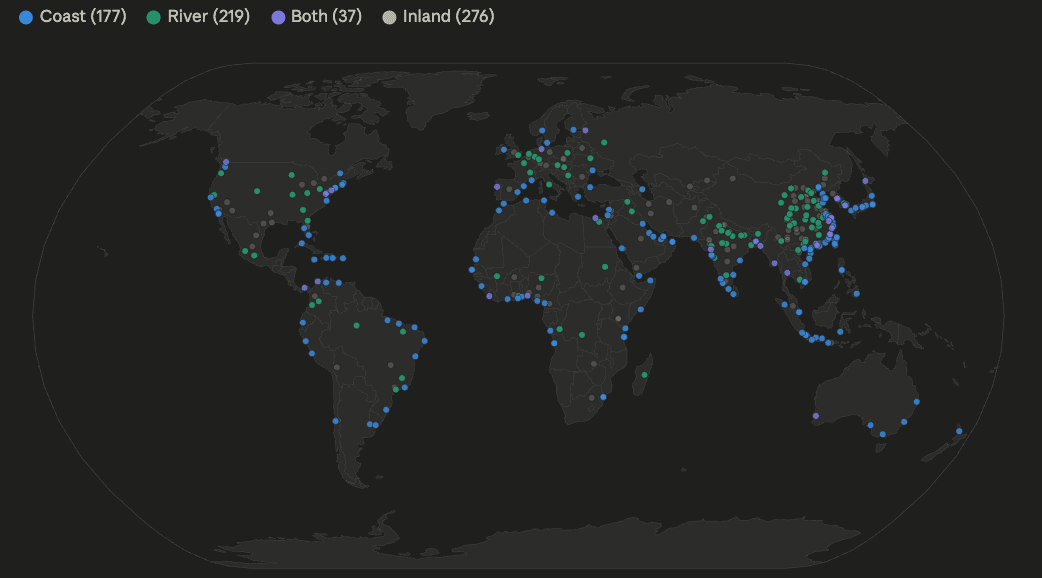
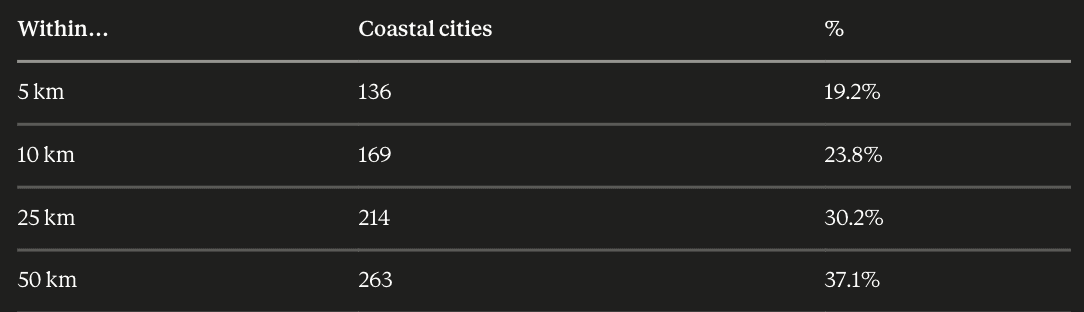
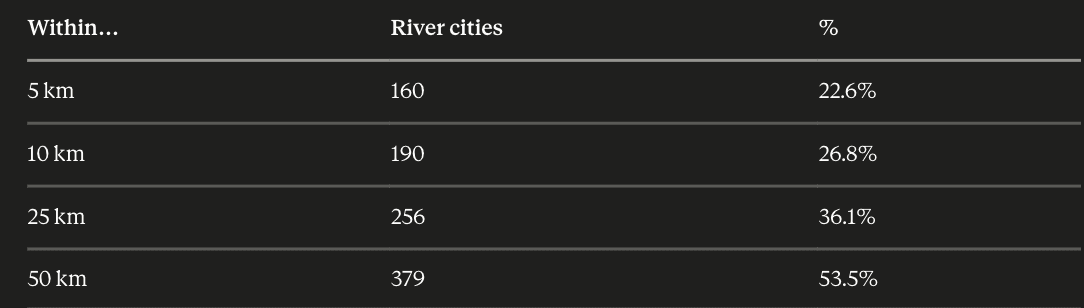
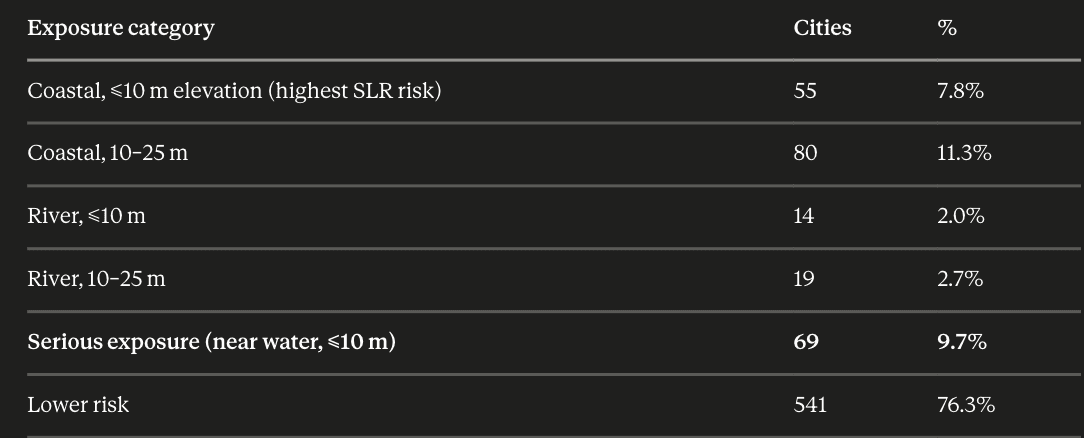
With the world’s population continuing to concentrate in cities and urban areas — estimated to reach around 80% by the end of this century[31] — it’s worth noting where those cities actually sit. Of today’s 709 cities with over a million people, 61.1% sit on a coast, a river, or both.[32] Not all of that proximity translates into real risk — once you factor in elevation as well, only about 9.8% face serious flood exposure, rising to 23.8% on a broader definition (city on the elevation of up to 25 m from the water level and / or within 25 m of a coastline or a major river) — but it means a large share of humanity’s urban future is being built in places whose relationship with water, and with the climate that shapes it, is now shifting.
References
- World Economic Forum. Youth Pulse 2026: Insights From the Next Generation for a Changing World. 2026. weforum.org/publications/youth-pulse-2026
- Walker, M. et al. Formal definition and dating of the GSSP for the base of the Holocene using the Greenland NGRIP ice core. Journal of Quaternary Science, 2009. onlinelibrary.wiley.com/doi/10.1002/jqs.1227
- Alley, R. B. The Younger Dryas cold interval as viewed from central Greenland. Quaternary Science Reviews 19, 213–226, 2000 — 8–16 °C glacial-interglacial swings from Greenland ice cores. sciencedirect.com/…/S0277379199000621
- Richerson, P. J., Boyd, R. & Bettinger, R. L. Was Agriculture Impossible during the Pleistocene but Mandatory during the Holocene? American Antiquity, 66(3), 2001 — the core hypothesis behind Figure 4. cambridge.org. Also: Bellwood, P. First Farmers: The Origins of Agricultural Societies — source of the per-region dates (Fertile Crescent 11k BP, New Guinea 10k, China 9k, Mesoamerica / Andes / Sub-Saharan Africa 8k, Eastern N. America 4k) shown on the map.
- NASA Science. Sun: Facts — mean Earth-Sun distance ≈ 149.6 million km. science.nasa.gov/sun/facts
- NOAA / NWS Storm Prediction Center. Lapse Rate reference. spc.noaa.gov/exper/soundings/help/lapse.html
- Seager, R. et al. Is the Gulf Stream responsible for Europe’s mild winters? Quarterly Journal of the Royal Meteorological Society, 2002. rmets.onlinelibrary.wiley.com/doi/10.1256/qj.01.128
- Roxy, M. K. et al. Indian Summer Monsoon Rainfall in a changing climate: a review. Journal of Water and Climate Change, 2023. iwaponline.com/jwcc/article/14/4/1061
- Lyons, T. W., Reinhard, C. T. & Planavsky, N. J. The rise of oxygen in Earth’s early ocean and atmosphere. Nature, 2014. nature.com/articles/nature13068
- NASA Science. Earth’s Atmosphere: A Multi-layered Cake — atmospheric composition reference. science.nasa.gov/earth/earth-atmosphere
- NASA Science. What is the greenhouse effect? Climate Change FAQ — natural greenhouse effect keeps Earth’s surface ~33 °C warmer than it would be otherwise. science.nasa.gov/climate-change/faq
- NOAA / NWS JetStream. Layers of the Atmosphere. noaa.gov/jetstream/atmosphere/layers-of-atmosphere
- NASA Science. Venus: Facts. science.nasa.gov/venus/venus-facts
- IPCC AR6 WG1, Chapter 7 — The Earth’s Energy Budget, Climate Feedbacks and Climate Sensitivity (methane GWP, Table 7.15). ipcc.ch/report/ar6/wg1 (Chapter 7 PDF)
- NOAA Global Monitoring Laboratory. Trends in Atmospheric Carbon Dioxide (Mauna Loa) and Trends in Atmospheric Methane. gml.noaa.gov/ccgg/trends / trends_ch4
- Ritchie, H. & Rosado, P. How have the world’s energy sources changed over the last two centuries? Our World in Data, 2020 — Industrial Revolution start and long-run energy shares. ourworldindata.org/global-energy-200-years
- IPCC. Special Report on the Ocean and Cryosphere in a Changing Climate, Headline Statements — ocean uptake of anthropogenic heat. ipcc.ch/srocc/headline-statements
- Rantanen, M. et al. The Arctic has warmed nearly four times faster than the globe since 1979. Communications Earth & Environment, 2022. nature.com/articles/s43247-022-00498-3
- Held, I. M. & Soden, B. J. Water Vapor Feedback and Global Warming. Annual Review of Energy and the Environment, 2000. annualreviews.org/doi/10.1146/annurev.energy.25.1.441
- Schuur, E. A. G. et al. Climate change and the permafrost carbon feedback. Nature 520, 171–179, 2015. nature.com/articles/nature14338
- Cohen, J. et al. Divergent consensuses on Arctic amplification influence on midlatitude severe winter weather. Nature Climate Change 10, 20–29, 2020. nature.com/articles/s41558-019-0662-y
- Copernicus Climate Change Service. Record heatwave brings hottest June for Western Europe during second-warmest June globally, 2026. climate.copernicus.eu (June 2026 bulletin). Historical benchmarks: 2003, 2019, 2022 heatwaves — Copernicus ESOTC 2022, Extreme Heat.
- Hugonnet, R. et al. Accelerated global glacier mass loss in the early twenty-first century. Nature 592, 726–731, 2021. nature.com/articles/s41586-021-03436-z
- Kreienkamp, F. et al. / World Weather Attribution. Rapid attribution of heavy rainfall events leading to the severe flooding in Western Europe during July 2021. 2021. worldweatherattribution.org
- MedECC. Climate and Environmental Change in the Mediterranean Basin — Current Situation and Risks for the Future, First Mediterranean Assessment Report (MAR1), Summary for Policymakers, Cramer, W., Guiot, J. & Marini, K. (eds.), UNEP/MAP, 2020. medecc.org (MAR1)
- Ditlevsen, P. & Ditlevsen, S. Warning of a forthcoming collapse of the Atlantic meridional overturning circulation. Nature Communications, 2023. nature.com/articles/s41467-023-39810-w
- European country temperature trends compiled from national and regional sources: Copernicus C3S — European State of the Climate 2024; UK Met Office — Central England Temperature series (1659–present) (2022 record +1.68 °C above 1961–90); Berkeley Earth global & national temperature data; Météo-France — climate reports (France +1.9 °C since 1900); DWD — German climate status reports; and MedECC — First Mediterranean Assessment Report (Mediterranean climate-change hotspot; ~1.4 °C above 1880–1899 regional baseline).
- Wikipedia — Uruk, en.wikipedia.org/wiki/Uruk; Memphis, Egypt, /Memphis,_Egypt; Mohenjo-daro, /Mohenjo-daro.
- Smith, A. An Inquiry into the Nature and Causes of the Wealth of Nations, Book I, Ch. 3 (“That the Division of Labour is Limited by the Extent of the Market”), 1776 — canonical primary source for water-vs-land transport cost advantages (his worked example: one small ship replacing hundreds of pack animals). The specific “10–30×” multiplier is a rough consensus across secondary economic history (Fogel, Bogart, Crafts) rather than one paper. gutenberg.org (Wealth of Nations)
- Krugman, P. Increasing Returns and Economic Geography. Journal of Political Economy 99(3), 483–499, 1991 — foundational paper on path dependence and urban agglomeration. journals.uchicago.edu/doi/10.1086/261763 (open PDF: princeton.edu (PDF))
- UN DESA Population Division. World Urbanization Prospects 2025. un.org/…/world-urbanization-prospects-2025. Long-range (~80% by 2100) projections: JRC Global Human Settlement Layer, ghsl.jrc.ec.europa.eu.
- Author’s own analysis. Global cities with populations over 1 million were matched against coastline and major-river proximity (25 km) with elevation thresholds (10 m & 25 m). Datasets used: SimpleMaps World Cities Database, Natural Earth coastlines & rivers, and GeoNames elevation data. Methodological reference: McGranahan, Balk & Anderson (2007) — Low Elevation Coastal Zones.