AI · Travel RAG case study · Part 4 of 5
Observability: instrumenting an AI application across four tools
Observability is supposed to tell you the truth about a running system. Mine did two worse things before it did that. It marked a failed request as a success, and it could crash a request it was only meant to watch. Observability that lies, or breaks what it measures, is worse than having none.
This is a deep-dive from my travel RAG case study. It covers how I wired four observability tools into an AI app through one shared module, what they caught in the first hour, and the two rules I now hold any telemetry code to.
1.Planning
Four tools, four different questions
An AI app fails in more ways than a normal web app: the model can be slow, expensive, wrong or invented, on top of the usual errors. No single tool answers all of that, so each tool got one job.
| Tool | The question it answers | Example |
|---|---|---|
| Langfuse | What did the model see, say and cost? | The prompt, the 5 retrieved chunks, the answer, tokens, cost, time to first token |
| Sentry | What broke, and where? | A stack trace when the vector store times out |
| PostHog | What do users actually do? | How many chats lead to a trip plan, and how many plans get exported |
| OpenTelemetry to Better Stack | Where did the time go? | The HTTP, database and model spans of one request, nested |
One tool per sub-phase
The plan had all four in one phase. I split it into four sub-phases: Langfuse first, then Sentry, PostHog and OpenTelemetry. Each signup and setup is a chance to get stuck, and doing them one at a time kept each session small. More importantly, the first integration set the pattern and the next three followed it.
Explicit spans, not magic
The tempting design was automatic: let the orchestrator open trace spans through Python context variables, so every route is traced for free. The risk was streaming. The chat route streams its answer, and context variables are least reliable exactly where streaming is hardest: errors mid-stream, cancellations, cleanup. A trace that silently stops halfway under load would be a miserable bug to find.
So I chose explicit spans opened in the routes, wrapped in a small helper module to avoid repetition. Slightly more code at each call site, but no hidden behaviour. That helper became the most important file in this part of the project.
2.Implementation
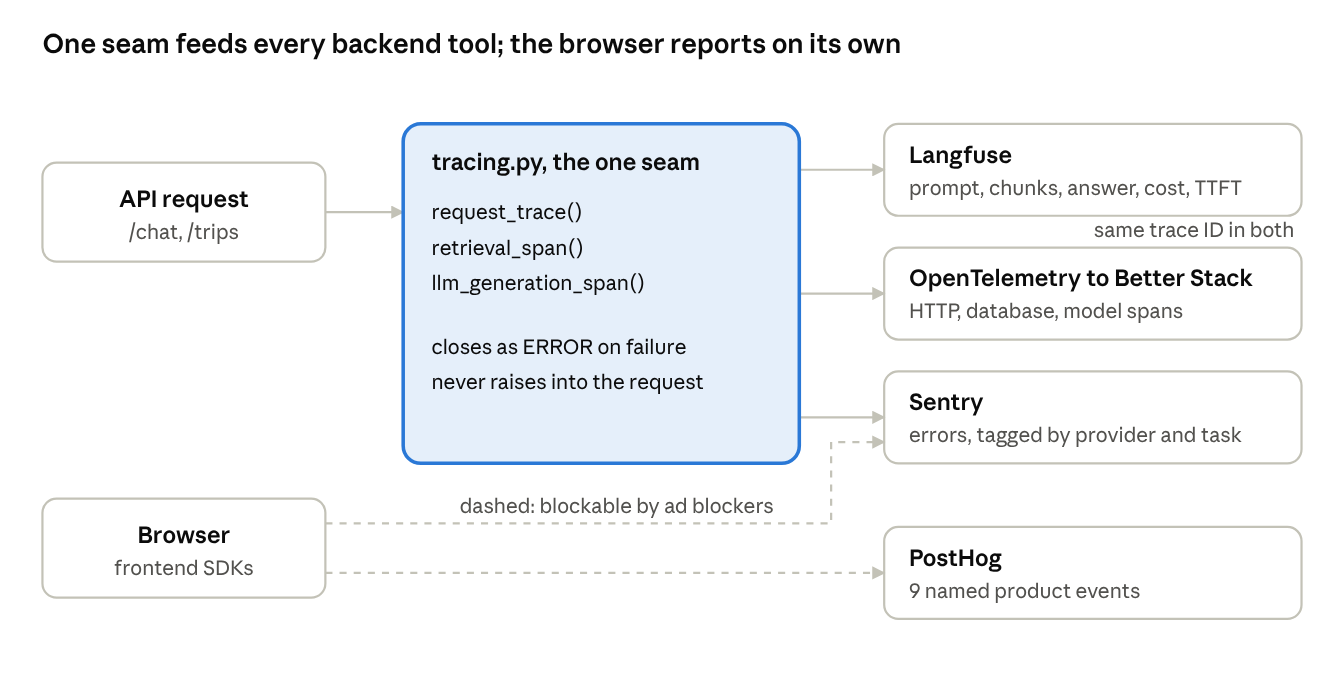
The seam
observability/tracing.py holds three async context managers. Every LLM call in /chat and /trips runs inside them:
async with request_trace("chat", provider=provider) as trace:
    async with retrieval_span(trace, query=message):
        chunks = await rag.query(message)
    async with llm_generation_span(trace, model=model) as gen:
        async for token in llm.chat_stream(...):
            yield token
When a tool's keys are not configured, the helpers do nothing, so local development and tests need no accounts. Tests use a stub client that records what would have been sent, and never touch the network.
Langfuse: what the model saw
One trace per request, with a retrieval span and a generation span inside it. Each carries the provider, the token counts, the cost and the time to first token. The eval harness writes to Langfuse too, so a production trace and an eval result look the same.
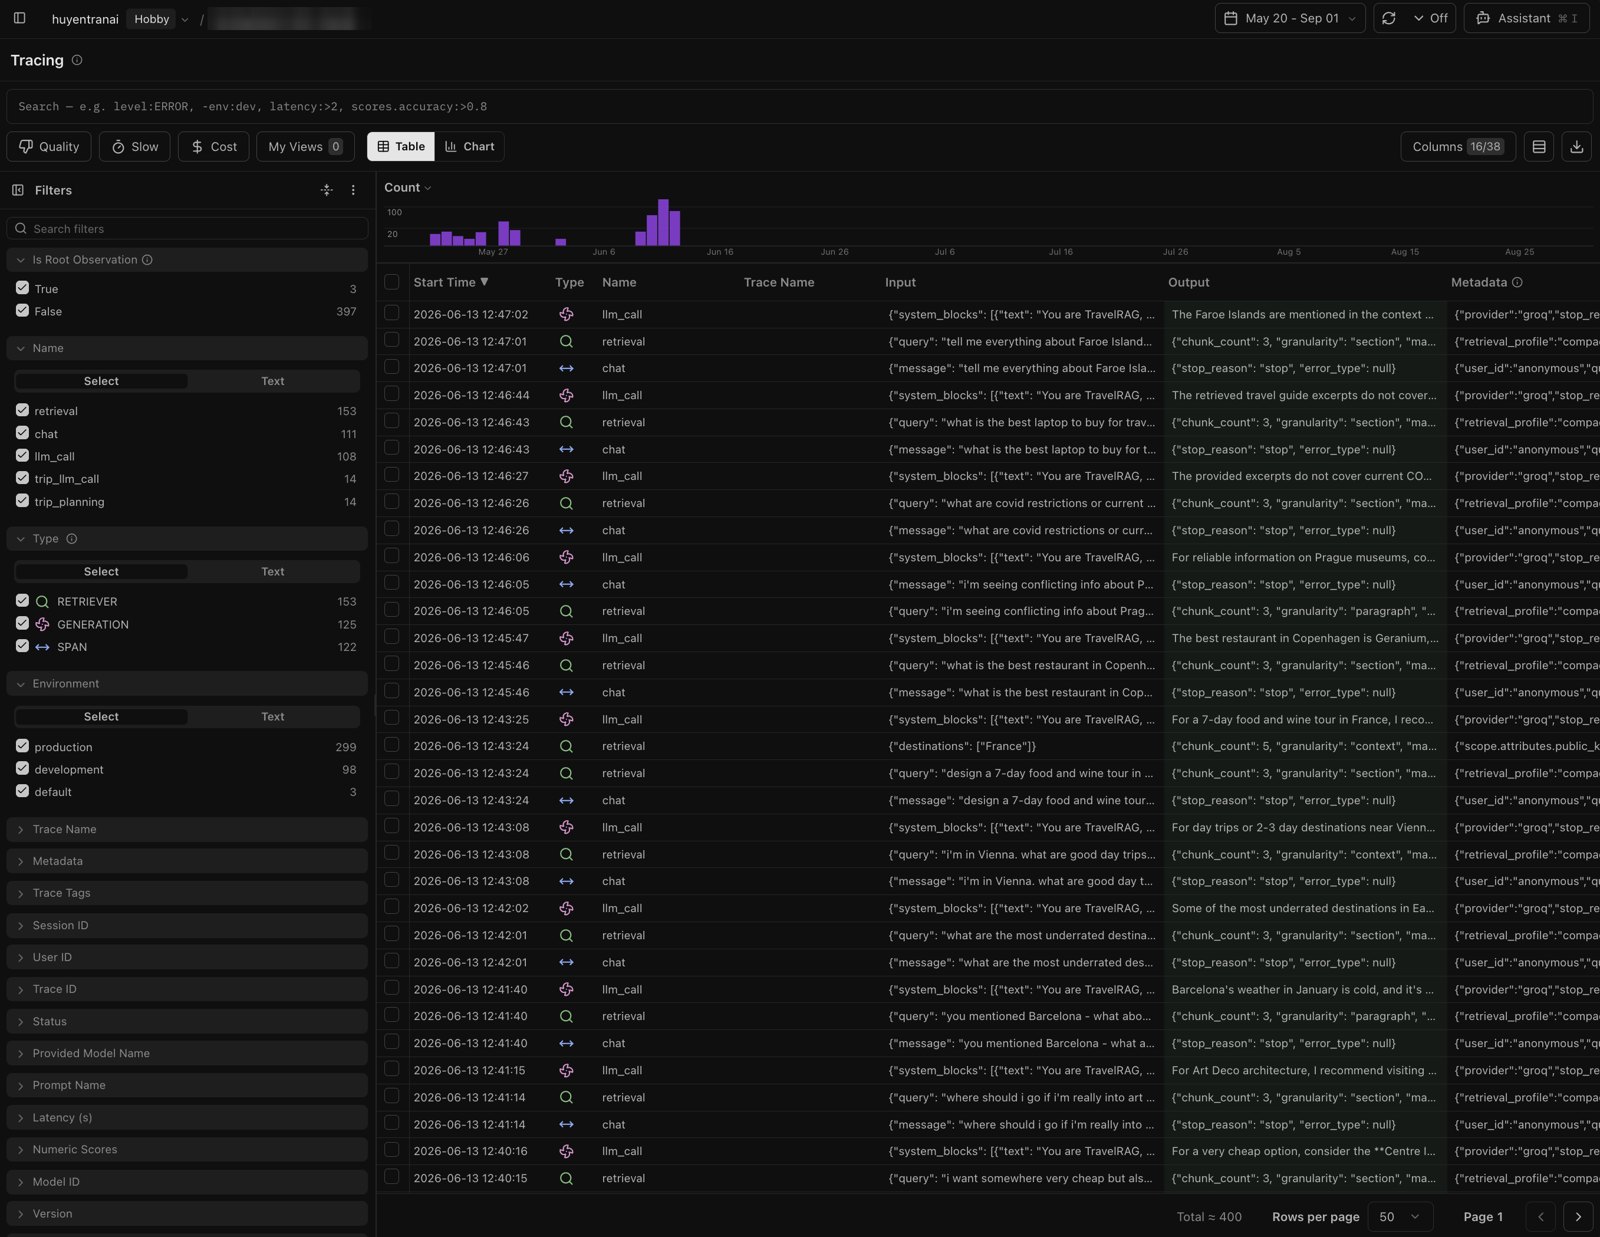
chat span with a retrieval and an llm_call inside it. The metadata shows the provider (here Groq) and the compact retrieval profile. The outputs show the system refusing to invent: "The retrieved travel guide excerpts do not cover…"Sentry: what broke
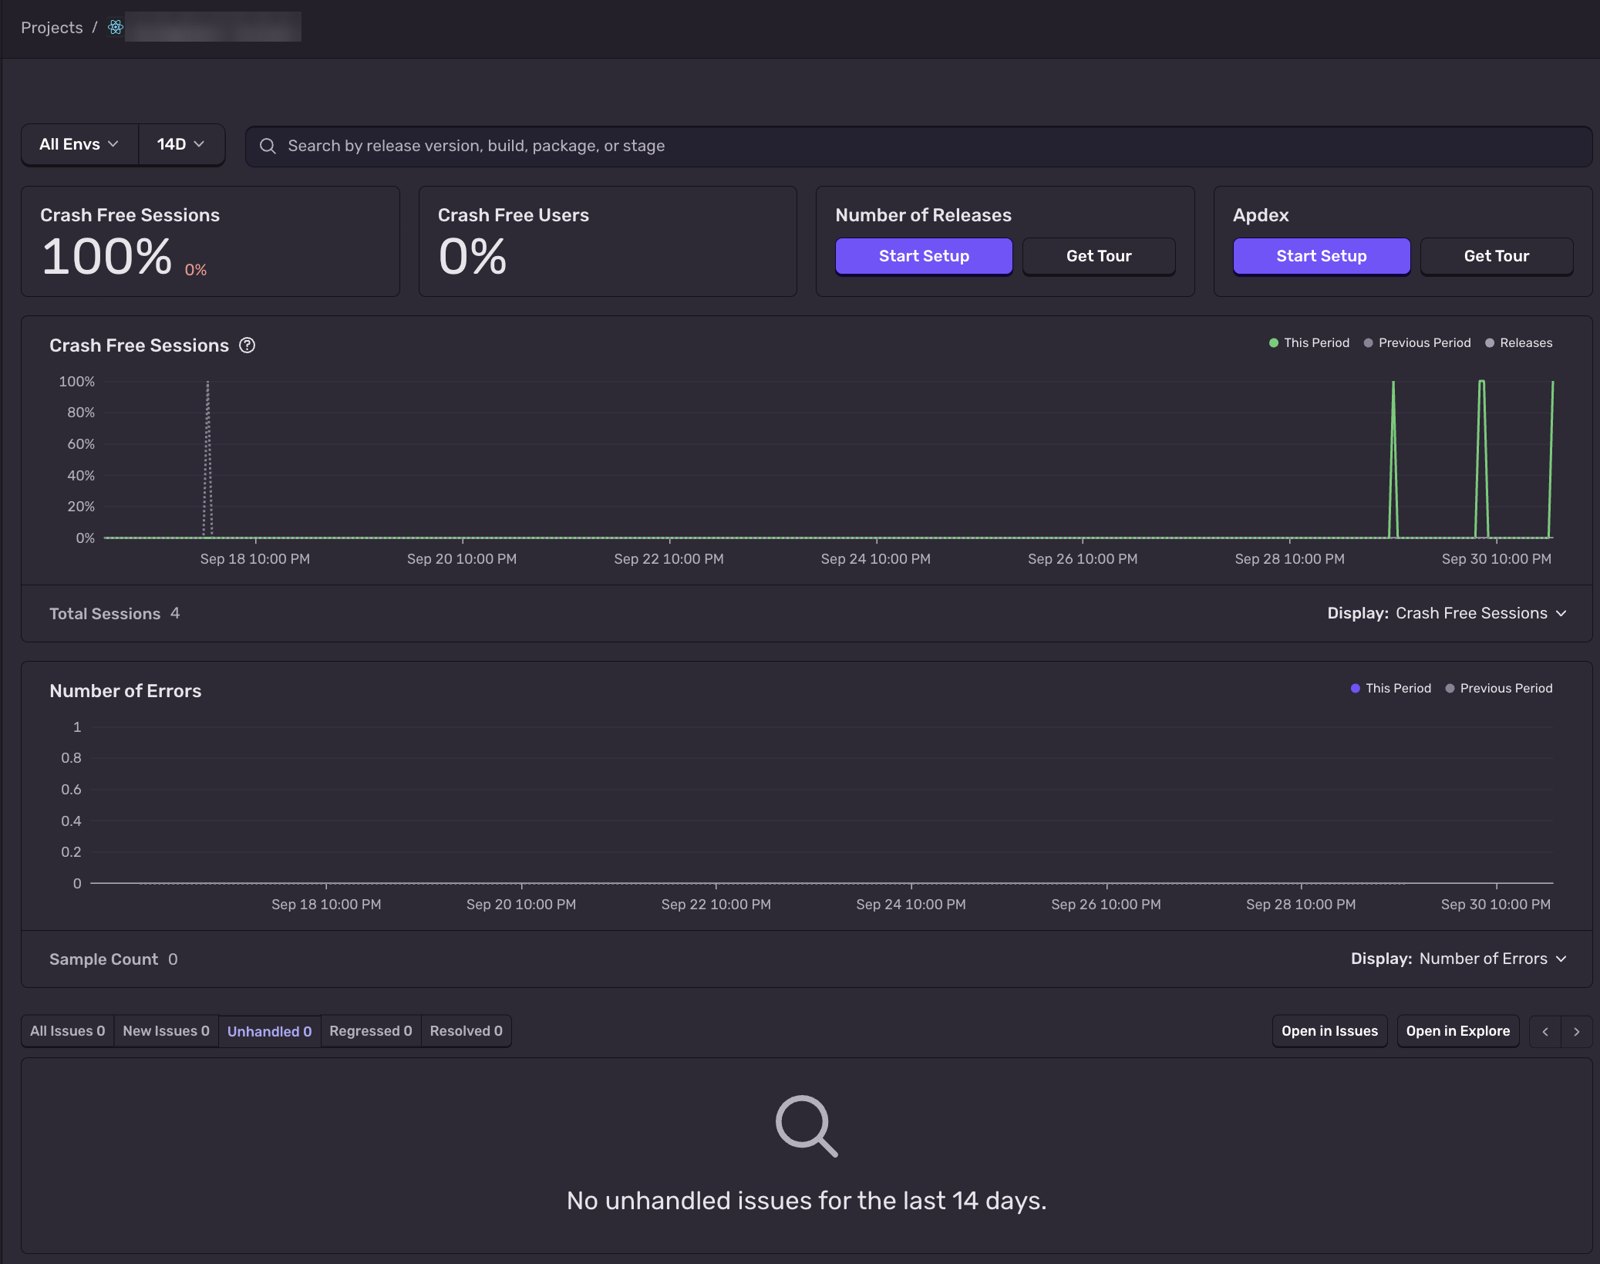
The backend tags every error with its provider and task, so the dashboard can filter "Groq trip-planning errors". Failures in third-party services (the model APIs, the vector store, Mapbox, Notion) share a marker class and are always reported, even when the user gets a polite error message. Pure domain errors, such as a question that is too long, are not reported: they are noise, not signal. Every event is tagged with the commit it came from, in both frontend and backend.
PostHog: what users do
Autocapture is off. The frontend sends ten named events, from chat_message_sent to itinerary_downloaded, with timing and token counts attached. That gives one funnel that matters: chat, then a trip plan, then an export.
OpenTelemetry: where the time went
Automatic instrumentation of FastAPI, outgoing HTTP calls and the Postgres driver, plus the seam's own spans, produce one nested tree per request in Better Stack. Langfuse is built on OpenTelemetry, so a Langfuse trace and its OpenTelemetry tree share the same trace ID.
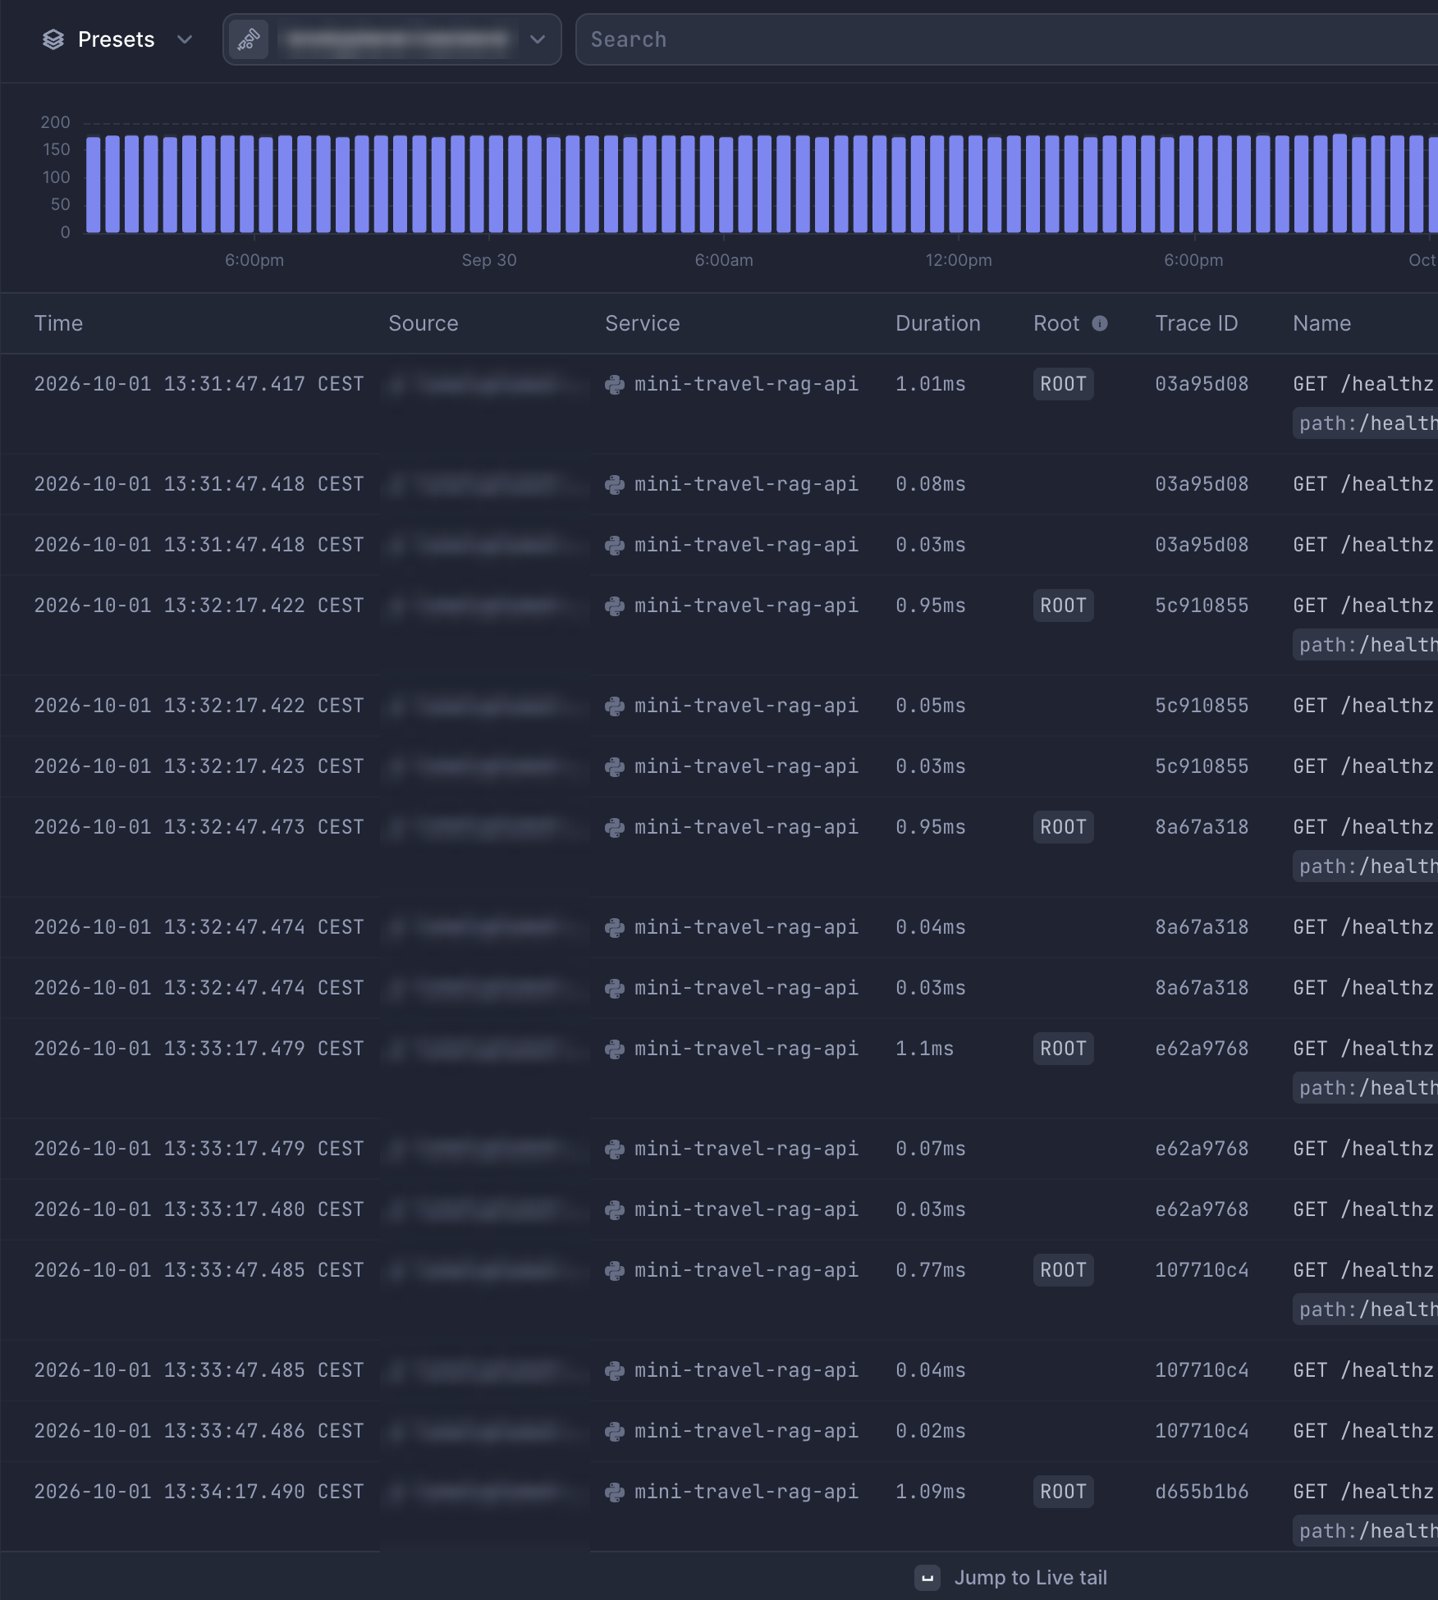
/healthz every 30 seconds. Real requests are a small minority of the volume, which is worth filtering or sampling before a free tier fills up with noise.3.Challenges
The first hour paid for the whole phase
The first thing Langfuse showed me was a bug in my own eval harness. Three test items scored 0.92, 0 and 0, and the per-trace view made it obvious that two judge calls had crashed and been recorded as zeros. The bug had been there since the eval phase. Without traces it would have shipped in every quality number I reported. (The full story is in my evals essay.)
Observability that lies, and observability that breaks
The production-readiness review of the tracing code found two bugs that belong together.
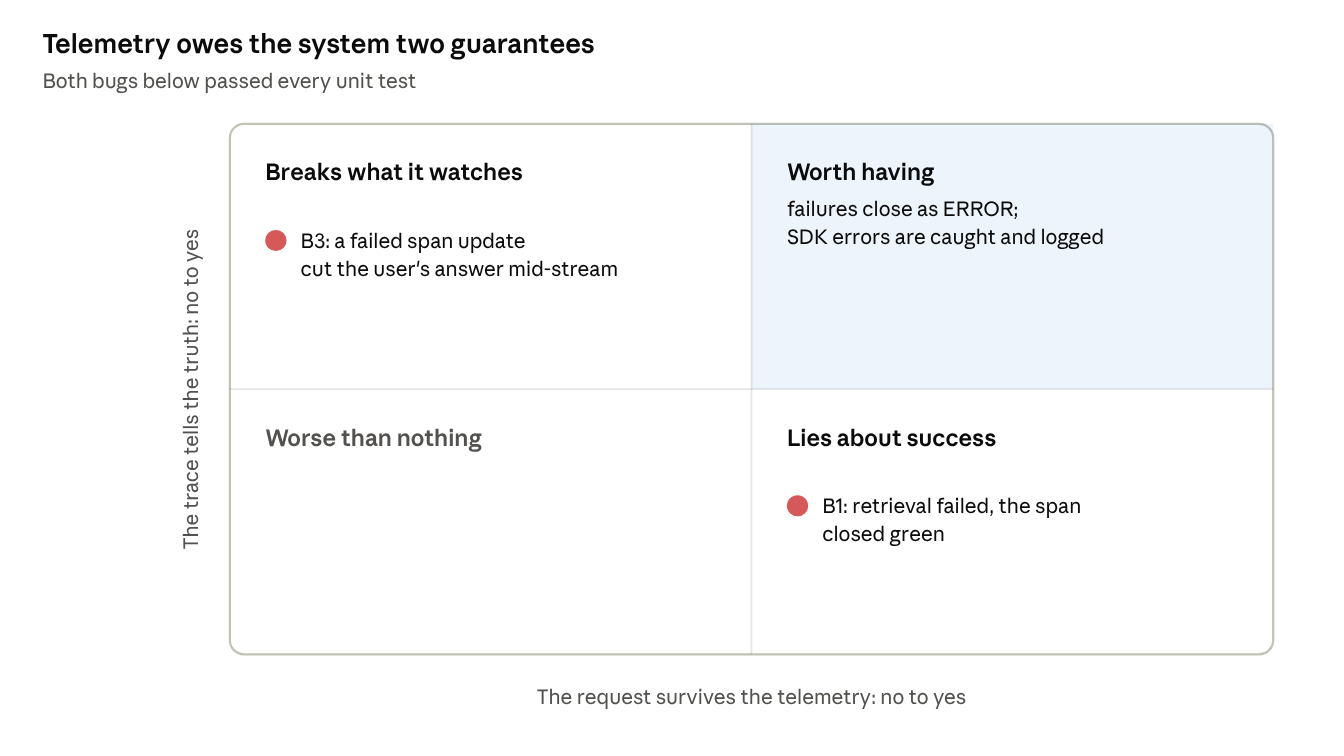
- B1: lying about success. When retrieval failed, the chat route sent the user an error and then used
returninside theretrieval_spanblock. Returning exits a context manager without an exception, so the span closed as a success. The dashboard showed green for a request that had failed. The fix: raise instead of return, so the span closes withlevel="ERROR". - B3: breaking the request. After streaming, the route updated the generation span with usage data. If that update itself failed, for example because the exporter timed out, the exception escaped the stream and cut the user's answer off mid-sentence. The telemetry caused the outage. The fix: wrap every telemetry call in
try/exceptand log at debug level.
Both passed every unit test. Only a deliberate review of failure paths found them, and each now has a regression test.
The ad-blocker tax
The backend Sentry test took ten minutes. The frontend one took two hours and had nothing to do with my code. The browser's network tab showed net::ERR_BLOCKED_BY_CLIENT: uBlock Origin blocks Sentry's and PostHog's ingest domains by default. My own browser was dropping my own telemetry.
Every real user with an ad blocker does the same, and the dashboard can't show what never arrives. The errors and funnel data I see are a biased sample. The fix is a tunnel: send telemetry to a path on your own domain and forward it from there. The code is ready (both SDKs read their host from config), but the tunnel is not built yet (TD-068).
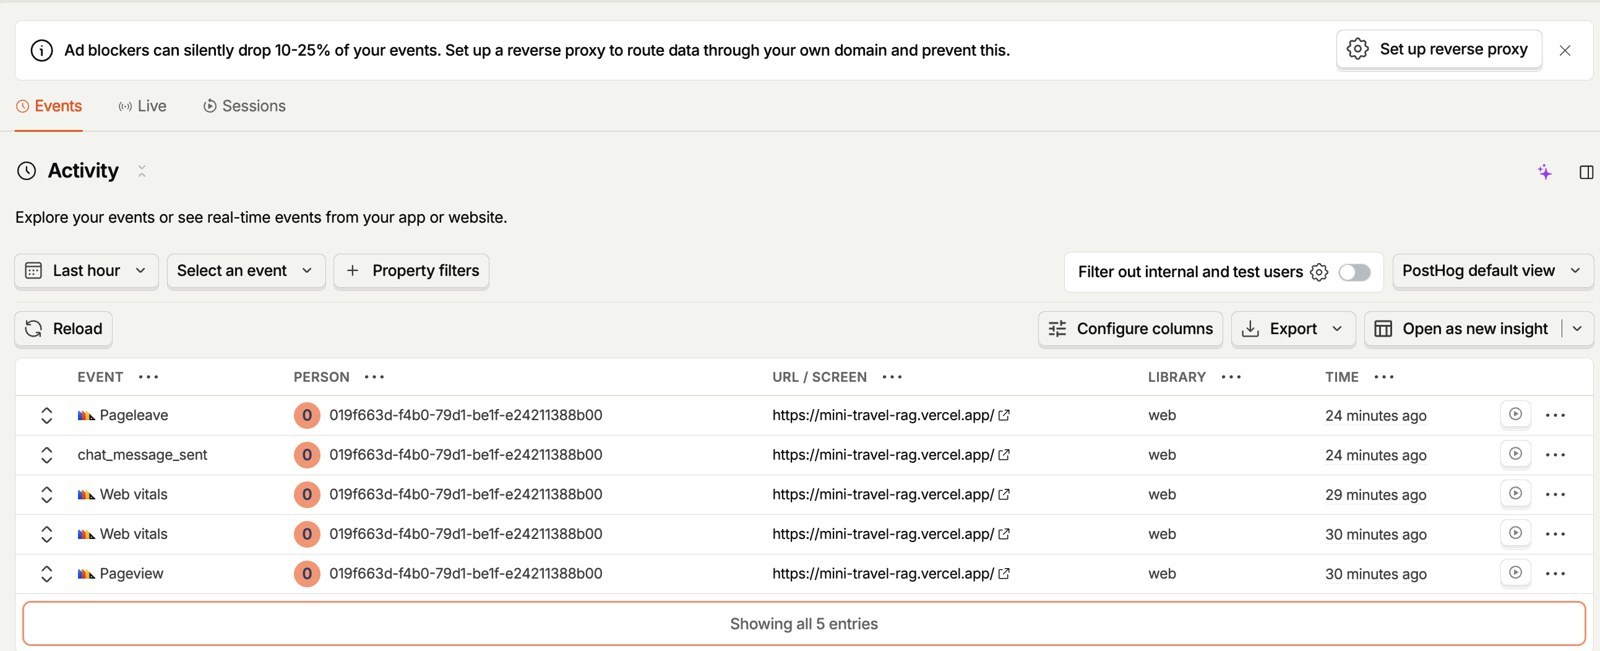
chat_message_sent event arrives next to page views and Web Vitals.Telemetry is a data leak waiting to happen
Vendor setup snippets optimise for "see your first event in 30 seconds". Sentry's suggested a hard-coded DSN and send_default_pii=True. I ignored both. The backend strips auth headers before events leave the process; the frontend strips OAuth tokens from URLs before Sentry or PostHog sees them. Later, a database error printed a full connection string, password included. Errors are now scrubbed of credentials where they are raised, before any tool can record them.
Four tools, not yet one story
Langfuse and Better Stack share trace IDs, but Sentry events are not yet tagged with them. When an error comes in, I cannot jump straight to its trace. It is a one-line change in the seam, waiting for real traffic to test it on (TD-078).
4.Final results
All four tools were built in Phases 14a to 14d, but they only went live in production at launch, when their keys were finally set on the server.
| Area | Status |
|---|---|
| LLM traces | Live: every /chat and /trips request, with cost and time to first token |
| Cost per provider | Live: Langfuse prices Claude and Groq calls automatically |
| Eval runs | Live: stored as Langfuse datasets, comparable per question |
| Errors | Live: backend and frontend, tagged by provider, task and commit |
| Product funnel | Live: chat → trip plan → download or Notion export, 10 named events |
| Request timing | Live: nested spans per request in Better Stack |
| Failure-path honesty | Fixed and tested: failed work closes its span as an error; telemetry errors never reach the user |
| Credential scrubbing | Live: headers, URL tokens, database URLs |
| Ad-blocker tunnel | Not built: frontend errors and events from ad-blocking users are lost (TD-068) |
| Error-to-trace links | Not built: Sentry events lack the trace ID (TD-078) |
| Readable frontend stack traces | Not built: source maps are not uploaded to Sentry yet (TD-067) |
Cost so far: nothing beyond time. All four tools ran on free tiers at portfolio traffic.
5.Learnings
- Telemetry must never lie about success. Every failure path has to close its span as an error. A green dashboard over a failed request is worse than no dashboard.
- Telemetry must never break the request. Every call to an observability SDK is wrapped and logged. The work being watched succeeds or fails on its own terms.
- Explicit beats magic in streaming code. Automatic context propagation is elegant until a stream is cancelled halfway. Explicit spans plus one helper module give safety without repetition.
- Build one seam. One module that every request passes through made four tools manageable. It is also where input filtering, sampling and trace-ID tagging will go.
- The first job of observability is finding your own bugs. Langfuse's first catch was a broken eval harness, not a production failure. Expect your tools to audit your other tools.
- The browser is hostile territory. Server-side telemetry is boring and reliable. Browser telemetry crosses ad blockers and privacy settings, so plan for loss, or tunnel it.
- Ignore the onboarding snippet. Vendor quick-starts trade hygiene for speed. Read the SDK reference and turn personal-data collection off.
- Unit tests don't find these bugs. Both anti-patterns and the ad-blocker loss passed every test. Reviewing failure paths on purpose, in a real browser, found them.
The short version: build observability so you can trust it, then check that you can.